Entries from August 26, 2018 - September 1, 2018
Are UK monetary clouds lifting?
UK monetary growth recovered further in July but could fall back in the wake of this month’s rate hike. August data should be awaited before upgrading economic expectations.
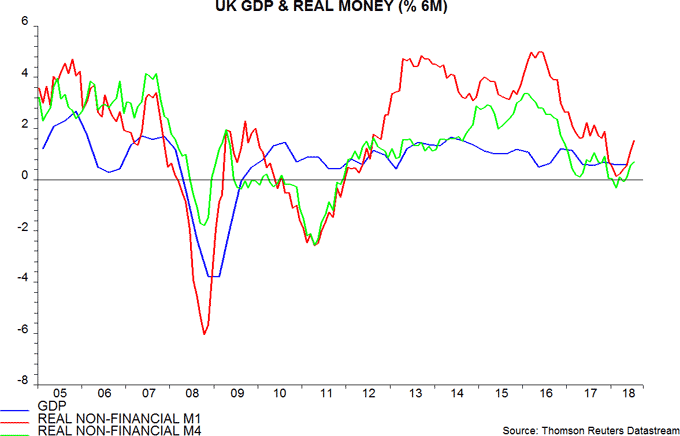
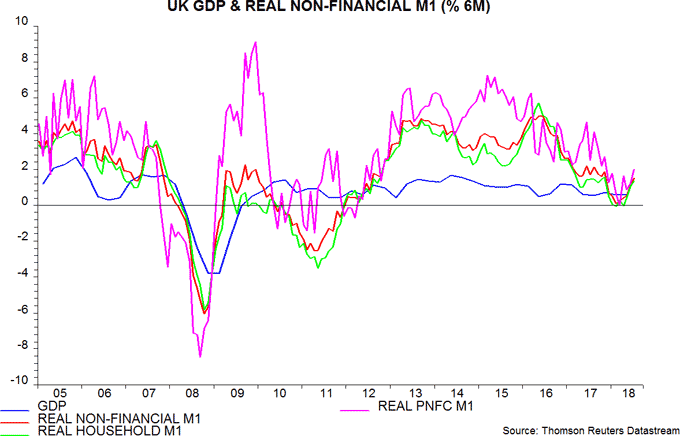
Six-month growth of real (i.e. inflation-adjusted) narrow money, as measured by non-financial M1, rose to its highest level since November 2017 in July, though remains below its range over the prior five years (i.e. back to August 2012). Real broad money – non-financial M4 – has also reaccelerated, following significant weakness earlier in 2018 – first chart.
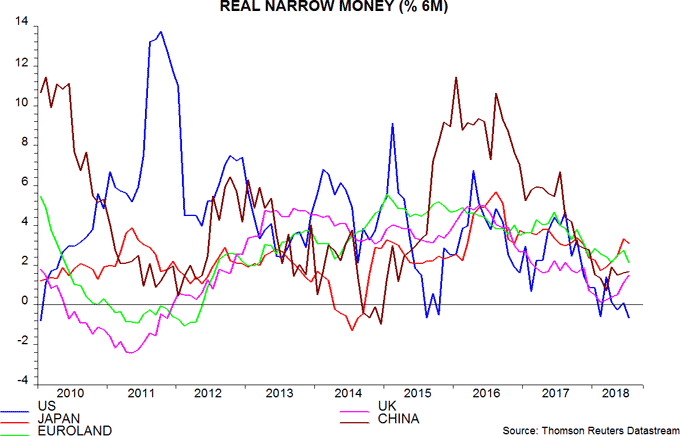
The rise in six-month real narrow money momentum in July contrasts with falls in the US and Euroland. UK growth remains lower than in Euroland but the gap is the smallest since October 2016 – second chart.
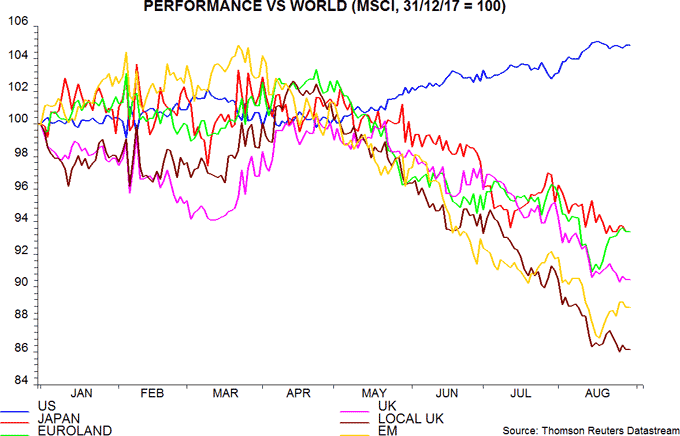
“Local” UK shares – as measured by the FTSE local UK index, which includes companies generating 70% or more of sales from the UK / Europe, the Middle East and Africa – have underperformed other markets significantly in currency-adjusted terms so far in 2018, undershooting even emerging markets – third chart. Improving absolute and relative monetary trends suggest that the case for underweighting UK shares is weakening.
The caveat, of course, is the unfortunate August rate hike, which risks aborting the monetary recovery. Six-month growth of narrow and broad money fell sharply immediately after the November rate increase.
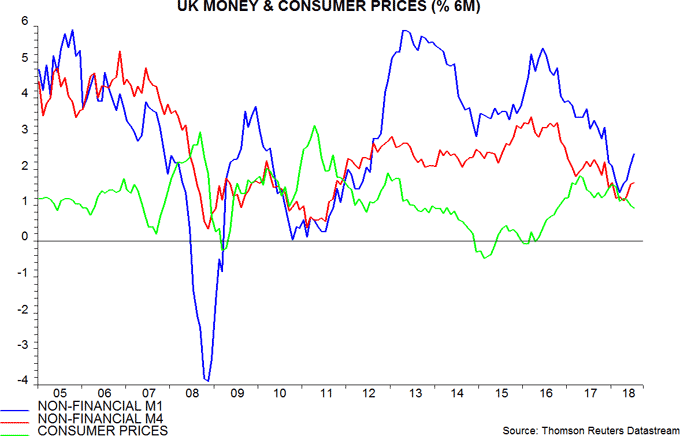
The recovery in real money growth, in addition, has been partly due to a slowdown in six-month consumer price inflation – fourth chart. This could reverse in the wake of recent sterling weakness – the effective exchange rate fell by 2.6% between April and July.
A cautious view of UK economic / market prospects, therefore, will be maintained here, at least pending August monetary data released at end-September.
Sectoral data show that the recent rise in six-month real narrow money growth has reflected increases in both the household sector and private non-financial corporate (PNFC) components – fifth chart. The latter improvement, in particular, is surprising, suggesting that businesses are not yet scaling back expansion plans in response to the supposed increased risk of a “no deal” Brexit.
Euroland money trends suggesting sub-consensus GDP growth
Euro area July money numbers were disappointing, suggesting that GDP growth will stick at its recent slower pace – contrary to consensus hopes that first-half weakening represented a temporary “soft patch”.
As usual, the focus here is on non-financial monetary aggregates, comprising holdings of households and non-financial corporations (NFCs)*. Six-month growth rates of real (i.e. inflation-adjusted) non-financial M1 and non-financial M3 fell in July and are back near lows reached in April and May respectively – see first chart.

Both real money growth measures declined significantly between June 2017 and April / May, correctly signalling the “surprise” weakening of GDP expansion in the first half of 2018. The sideways move since April / May suggests that economic growth will continue at around its recent pace through the first quarter of 2019 – GDP may rise at a 1.25-1.5% annualised rate, below ECB and consensus forecasts of 1.75-2.0%.
The fall in six-month real non-financial M1 growth in July reflected notably weaker expansion of non-financial corporate deposits – second chart. This may signal a scaling-back of business expansion plans in response to uncertainties around US trade policy, Brexit, the ending of QE and Italy / EU relations.
Curbed business expansion would be expected to feed back into consumer spending via reduced hiring and slower expansion of worker incomes. Corporate real M1 holdings display a stronger correlation with future GDP expansion than household holdings, according to ECB research.

The third chart shows six-month growth rates of real non-financial M1 deposits in the "big four” economies. The Euro area slowdown over the past year has been driven by France and Spain, suggesting a greater loss of economic momentum in those two countries – already evident in French GDP data for the first half.

Italian real deposit growth has been volatile but weakened sharply in July. Monetary trends led the Italian / German yield spread around the 2011-13 recession but have lagged the spread recently; with the latter widening further, the monetary slowdown may be sustained – fourth chart.

*The headline M1 / M3 aggregates also include financial sector money holdings, which are more volatile and display a lower correlation with future GDP expansion, according to ECB research.
