Entries from June 24, 2018 - June 30, 2018
UK data mixed, money trends still soft
UK monetary trends have stabilised but remain weak, suggesting continued sub-par economic expansion. The monetary slowdown has been reflected in a significant fall in nominal GDP growth, the current level of which is below that consistent with achievement of the 2% inflation target over the medium term. The view here remains that the MPC should wait for a rebound in money growth before considering a further rate hike.
Economic data released today were mixed. Quarterly GDP growth in the first quarter was revised up from 0.1% to 0.2% but the annual increase was unchanged at 1.2%, reflecting a downgrade to the third quarter of 2017.
Services output rose by 0.3% in April from March but overall GDP in April – taking into account industrial and construction data – appears to have been only 0.1% above the first-quarter level, implying a need for solid May / June data to meet the Bank of England staff projection of 0.4% quarterly growth in the second quarter.
Annual growth of nominal (i.e. current-price) GDP, meanwhile, declined further to 2.7% in the first quarter, compared with a recent peak of 4.9% in the fourth quarter of 2016. Unless potential output expansion has fallen below 1% per annum, such a growth rate, if sustained over the medium term, would imply an undershoot of the 2% inflation target.
The money measures tracked here rose respectably between April and May but their trends remain weak, arguing against an early rebound in real / nominal economic expansion.
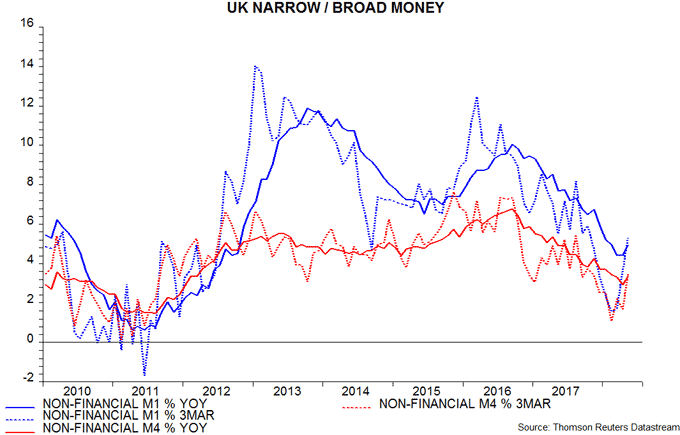
Annual growth rates of non-financial M1 and non-financial M4 more than halved between September 2016 and April 2018 but recovered slightly in May. Three-month rates of expansion, moreover, crossed above the annual increases – see first chart.

The annual growth rates remain lower than for the comparable Euroland measures, suggesting continued relative economic weakness. Non-financial M1 rose by 4.9% in the UK in the year to May versus 7.6% in Euroland; non-financial M4 grew by 3.3% versus a 3.9% increase in Euroland non-financial M3. The difference, of course, is larger in real terms, with UK consumer price inflation at 2.4% in May versus 2.0% in Euroland in June.
Six-month rates of change of real non-financial M1 and non-financial M4, while recovering slightly, remain well below recent and longer-term historical averages – second chart. As previously discussed, real money trends held up through November 2017 but weakened sharply after the rate hike that month, which appears to have damaged confidence and spending intentions. A mooted August follow-up increase would probably abort the recent tentative monetary recovery, risking more significant economic weakness in 2019.

Euroland money data slightly better, trends still subdued
Euroland monetary trends have stabilised, suggesting that economic growth will be sustained at its recent slower pace through late 2018. The ECB / consensus forecast that GDP will expand at a 1.75-2% annualised rate appears over-optimistic. Real narrow money growth has fallen in Italy but is only slightly lower than in the other major economies, although a further slowdown is likely.
Annual growth rates of Euroland non-financial M1 and non-financial M3 – the preferred aggregates here – fell significantly between March 2017 and March 2018 but recovered slightly in April / May. Three-month rates of expansion, moreover, have moved above the annual growth rates and are at their highest levels since October / November 2017 – see first chart.

The shorter-term reacceleration is less impressive in real terms because of a rebound in consumer price inflation. Nevertheless, six-month growth rates of real non-financial M1 / M3 have stabilised recently – second chart*.

The current six-month real growth rates are similar to those prevailing in mid-2013, following which GDP expanded at an annualised rate of 1.4% through end-2014. This seems a reasonable expectation for growth over coming quarters. The latest ECB staff projections of annual average GDP increases of 2.1% in 2018 and 1.9% in 2019, by contrast, imply sequential expansion of 1.75-2% annualised.
Narrow money trends remain similar across the “big four” economies but six-month growth of real non-financial M1 deposits is now weakest in Italy, with the recent rise in Italian yield spreads suggesting a further decline – third and fourth charts.


Corporate real M1 deposits, moreover, have slowed sharply recently in Italy and Spain, possibly reflecting a loss of business confidence and an associated reining back of expansion plans – fifth and sixth charts. The Euroland GDP slowdown to date has been driven by Germany and France but risks may now be shifting to the periphery – excluding Greece, where money measures are surging.


*Abbreviations: HH = household, NFC = non-financial corporation.

