Entries from June 3, 2018 - June 9, 2018
Euroland GDP details downbeat
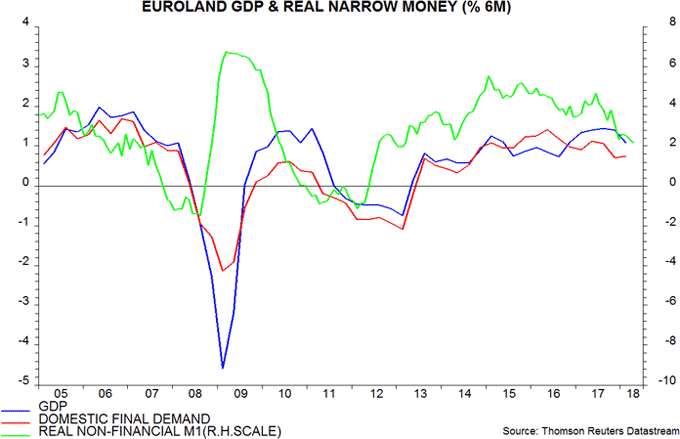
A post in March argued against consensus positivity about Euroland economic prospects, noting that domestic final demand had already slowed while net export strength was likely to fade as a result of euro appreciation and falling global momentum. GDP expenditure details for the first quarter released today are consistent with this assessment. Monetary trends suggest further weakness in domestic final demand while net exports may continue to struggle without a much more significant fall in the exchange rate.
The GDP report confirmed a 0.4% increase in the first quarter, down from 0.7% in the fourth quarter of 2017. Domestic final demand – i.e. consumption and fixed investment – rose by 0.35%, while net exports subtracted 0.15 percentage points (pp) from the quarterly GDP change. Total final demand, therefore, expanded by just 0.2%, down from 0.8% in the fourth quarter. GDP growth was supported by a 0.2 pp contribution from inventories – stockbuilding rose to a nine-quarter high.
Euroland narrow money trends lead GDP developments but appear to have an even closer relationship with domestic final demand. Two-quarter demand growth peaked as long ago as the second quarter of 2016, following a peak in six-month real narrow money growth in January 2015 – see chart. The two-quarter demand change recovered slightly in the first quarter, as expected here in March on the basis of a temporary revival in narrow money trends in the first half of 2017. The subsequent fall in real narrow money growth to a five-year low in April suggests that domestic final demand will slow further into late 2018 / early 2019.

Net exports are unlikely to take up the slack against the backdrop of an expected global economic slowdown and a current effective exchange rate level still 3% above its 2017 average (Bank of England measure).
The rise in inventories in the first quarter, meanwhile, was probably involuntary and fits with the view here that the global stockbuilding (Kitchin) cycle is approaching a peak and will act as a drag on economic growth in late 2018 / 2019.
Leading indicators still softening
The OECD’s G7 composite leading indicator continues to soften, supporting the forecast here, based on monetary trends, of a global economic slowdown.
The OECD will publish an April update of its leading indicators on 13 June but most of the component information is already available, allowing an independent calculation.
The first chart shows the ratio of G7 GDP to the OECD’s estimate of trend together with the "normalised" (i.e. trend-adjusted) leading indicator – both official and independently-calculated. The indicator is estimated to have declined again in April, increasing the likelihood that the recent peak marked a significant turning point. The indicator, that is, has switched from signalling above-trend economic expansion in 2017 to below-trend now.

The estimated April decline in the indicator was again driven by European countries and Japan but the rise in the US indicator slowed, suggesting that it is approaching a turning point – second chart.

The components of the US indicator are: housing starts, durable goods orders, consumer sentiment, the ISM manufacturing purchasing managers’ index, average weekly hours worked in manufacturing, share prices (NYSE composite) and the slope of the yield curve (10-year Treasury yield minus effective fed funds rate). All components enter as deviations from their estimated trends. The recent slowdown in the indicator reflects negative contributions from the survey measures (consumer sentiment, ISM PMI), share prices and housing starts; its continued rise has been driven by the “hard” manufacturing components – durable goods orders and average weekly hours.
The OECD country indicators do not, in most cases, include a monetary aggregate, so they provide an independent, though less timely, cross-check of monetary signals. Another drawback relative to the monetary data is that the indicators can sometimes be revised significantly, mainly reflecting changes to the estimated trends in the components as new information is incorporated.

