Entries from March 25, 2018 - March 31, 2018
UK monetary alarm bells ringing louder
UK monetary trends continued to weaken in February, suggesting deteriorating economic prospects and arguing for the MPC to hold off on plans to raise interest rates.
The preferred narrow and broad money aggregates here are non-financial M1 and M4, comprising money holdings of households and private non-financial corporations (PNFCs). Annual growth rates of the two measures fell further to 5.0% and 3.5% respectively in February, the lowest since 2012 and down from peaks of 10.1% and 6.8% in September 2016 – see first chart. The monetary slowdown has been reflected in a decline in annual growth of nominal GDP, to 3.1% in the fourth quarter of 2017. Such a rate of increase, if sustained, would suggest an undershoot of the 2% inflation target over the medium term, assuming trend real economic expansion of around 1.5%.

Discussion of UK monetary trends normally focuses on the Bank of England’s M4ex measure, which includes broad money holdings of non-intermediate other financial corporations (OFCs) as well as those of households and PNFCs. Annual growth of M4ex fell to 4.5% in February but is in line with its average over 2013-17, giving a more favourable impression of economic prospects than the non-financial measures. M4ex, however, continues to be inflated by rapid expansion of non-intermediate OFC money holdings, which rose by 10.2% in the latest 12 months and are up by a quarter since February 2016. Such holdings appear to contain little information about near-term spending prospects but have been correlated recently with current (not future) share price movements: market weakness, therefore, suggests a fall in their growth rate – second chart.

Returning to the non-financial money measures, shorter-term trends have weakened significantly further since the November interest rate increase, signalling a likely further fall in annual growth rates. Non-financial M1 rose at an annualised rate of 1.6% in the three months to February, with non-financial M4 growing by 1.1% – third chart.

The fourth chart shows the six-month rate of change of real (i.e. deflated by consumer prices) non-financial M1 and household / PNFC components. Aggregate growth fell to just 0.1% in February, with household real M1 in contraction and the PNFC component continuing to slow, consistent with deteriorating prospects for both consumer spending and business investment. These trends, coupled with global monetary weakness discussed in previous posts, suggest that Bank of England and Office for Budget Responsibility forecasts of GDP growth during 2018 (i.e. in the year to the fourth quarter) of 1.8% and 1.4% respectively will be undershot, possibly significantly.

Euroland economic prospects still deteriorating
Euroland monetary trends and the OECD’s composite leading indicator continue to soften, suggesting that a recent economic slowdown will extend through late 2018, at least.
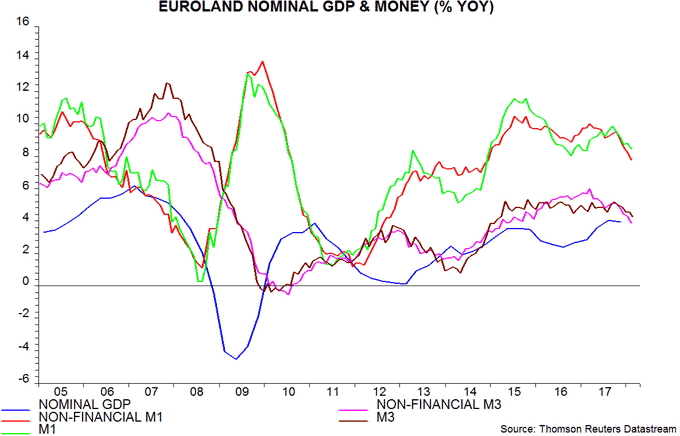
Annual growth rates of the headline M1 and M3 money measures fell to 8.4% and 4.2% respectively in February, extending a decline from peaks in September 2017 of 9.8% and 5.2% respectively. The preferred narrow and broad aggregates here are non-financial M1 and M3*, reflecting their superior historical forecasting performance. These measures have slowed more significantly, with annual growth down to 7.8% for non-financial M1 and 3.9% for non-financial M3 in February, the lowest since 2014-15 – see first chart.

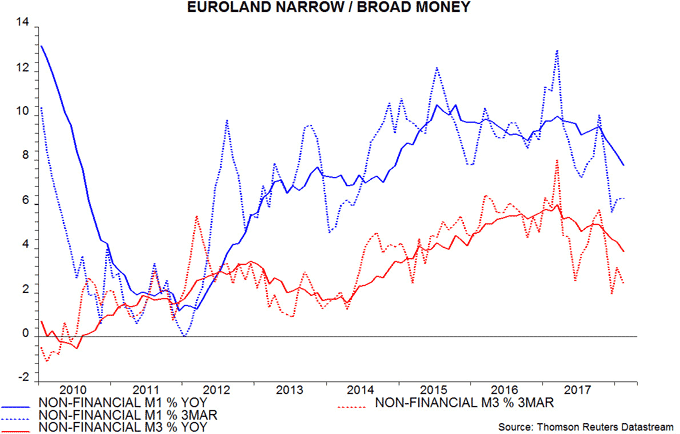
Shorter-term trends suggest that annual growth rates will subside further. Non-financial M1 rose at an annualised rate of 6.3% in the three months to February, with non-financial M3 growing by only 2.4% – second chart.

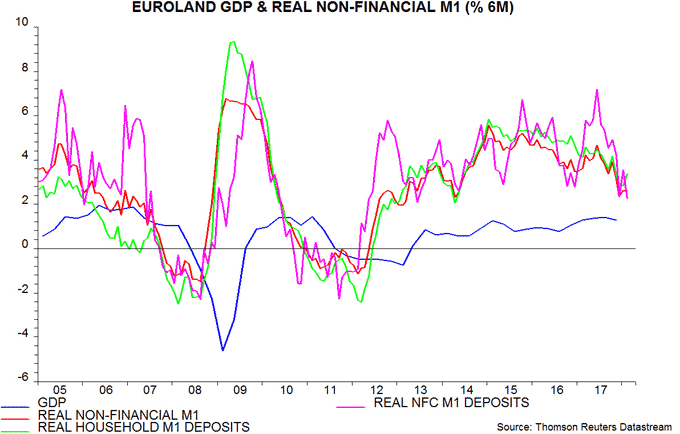
The third chart shows six-month growth of real (i.e. deflated by consumer prices) non-financial M1 and household / corporate components. Aggregate growth is back around its level in late 2012 through early 2014, following which GDP grew at an annualised rate of 1.0-1.5% – well below current consensus and ECB forecasts. Corporate holdings have slowed particularly sharply in recent months and exhibited a stronger correlation with future GDP than household holdings historically, according to ECB research.

The ECB publishes a country breakdown of overnight deposits, which account for more than 80% of M1. Six-month growth of real deposits has fallen steeply in France and Spain since August-September 2017, converging with sluggish German expansion – fourth chart. Recent weaker French business surveys are consistent with the monetary slowdown and suggest that President Macron’s economic honeymoon period has ended. Italian real deposit growth, surprisingly, held up through February but increased policy risk following this month’s election could lower confidence / spending intentions and encourage capital flight, thereby weakening monetary trends.

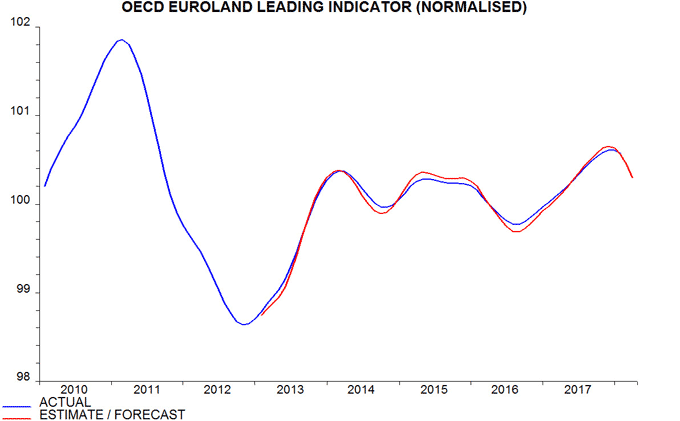
The OECD’s Euroland composite leading index, which typically lags monetary trends by several months (and excludes money measures), confirms softer economic prospects. The normalised version of the index is estimated to have declined again in February, with a further reduction projected for March – fifth chart**. The normalised index is designed to predict GDP relative to trend, so the shift from rising to falling suggests that recent strong growth will give way to below-trend expansion.

*Non-financial = covering holdings of households and non-financial corporations (NFCs), i.e. excluding financial sector money.
**The OECD is scheduled to release a February reading on 10 April but most of the component information is available, allowing an independent calculation.

