Entries from March 11, 2018 - March 17, 2018
Chinese activity firmer but money trends still signalling weakness
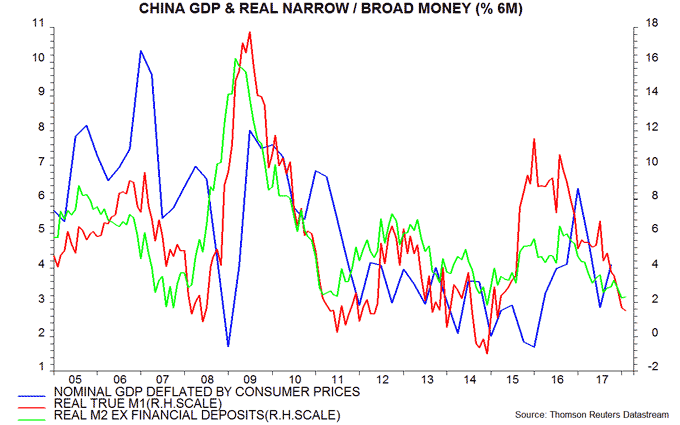
Stronger Chinese economic activity numbers for January-February may partly reflect a holiday timing effect but are also consistent with resilient monetary growth in mid-2017. More recent monetary weakness suggests a progressive loss of economic momentum over the remainder of 2018. Money growth measures were little changed in February but a significant rebound is unlikely without policy easing.
Most activity series came in above consensus expectations in January-February. Annual growth of industrial production, for example, rose to 7.2% from 6.2% in December. The late timing of the New Year holiday may have contributed to this pick-up, by pushing some of the usual production loss into March. The New Year also occurred in mid-February in 2015, 2010 and 2007 – annual production growth was lower in March than in January-February in all three cases, by an average of 1.6 percentage points, i.e. growth may fall back to or below its December level this month.
Current economic resilience, however, is consistent with earlier monetary trends. Six-month growth of real narrow money remained solid by historical standards through September 2017, before falling sharply over October-January – see chart. A further slight decline in February reflected a pick-up in six-month consumer price inflation, probably also influenced by the late New Year. Allowing for a typical nine-month lead, this suggests a significant weakening of economic data from mid-2018.

Broad money trends are similarly downbeat: six-month growth of real broad money was unchanged in February near the bottom of its range in recent years.
Business surveys have been mixed recently but are probably peaking. The PBoC’s first-quarter survey of 5000 enterprises reported a small decline in the domestic orders index and a levelling out of the export orders index, after adjusting for seasonal movements – second chart.

UK Spring Statement: Hammond hemmed in
Hopes that recent lower-than-expected borrowing would create room for Chancellor Hammond to loosen the fiscal reins in his autumn Budget have been dented by the Office for Budget Responsibility’s latest forecast.
The OBR revised 2017-18 borrowing down by only £4.7 billion versus expectations of up to £10 billion. Moreover, the reduction in current and future years is attributed to a cyclical boost from the economy operating at a higher level relative to potential rather than an improved structural position. The OBR left its forecast for the structural deficit in 2020-21 unchanged at 1.3% of GDP – well within the “fiscal mandate” requirement of below 2.0% but implying no additional headroom relative to the November forecast.
The new economic numbers are similarly conservative: average GDP growth of 1.4% per annum over 2018-22 is marginally lower than in November, while the OBR has dismissed recent better productivity performance as a temporary blip.
The borrowing undershoot in 2017-18 reflects stronger growth of nominal GDP and receipts than the OBR projected. The new forecast shows nominal GDP growth falling from 3.8% in 2017 to 3.1% in 2018. This looks realistic and may even prove over-optimistic: the year-on-year rise in nominal GDP eased to 3.2% in the fourth quarter of 2017 and monetary trends suggest a further slowdown – see chart.

Global money data still weakening
The global narrow money slowdown appears to have extended in February, suggesting that 1) economic prospects for later in 2018 continue to deteriorate and 2) the liquidity backdrop for equities and other risk assets remains unfavourable.
The US, China, Japan and India have released monetary data for all or part of February. Based on this information and available inflation data, six-month growth of real narrow money in the G7 plus E7 economies is estimated to have fallen to about 0.75% (not annualised) – a significant further drop from 1.3% in January*. It last moved below 1% from above in November 2007, in the early stages of the financial crisis and ahead of the 2008-09 recession – see first chart.

That recession, and all previous global economic downturns since the 1960s (at least), were preceded by a contraction of real narrow money. The expectation here is that the six-month growth rate will stabilise or recover slightly over coming months, reflecting a moderation in six-month consumer price inflation and a partial reversal of recent US weakness. Even if this proves correct, the monetary slowdown since mid-2017 promises a significant downshift in economic growth over the remainder of 2018.
The further fall in global real narrow money growth in February was driven by the US, where the six-month change appears to have turned negative. Chinese growth is estimated to have been little changed in February after a large fall in January**, while Japanese growth weakened slightly further – second chart.

*The four countries mentioned account for 62% of the G7 plus E7 aggregate. The estimate assumes unchanged money growth and / or inflation in countries for which February data are not yet available.
**China has released data for M1 / M2 but not household demand deposits, which are included in the narrow money measure tracked here. The estimate assumes a 7% month-on-month rise in such deposits, based on experience in previous years with a late New Year holiday.

