Entries from January 21, 2018 - January 27, 2018
Global money trends still weakening
Global policy-makers are trumpeting “synchronised” economic growth. They should, instead, be worrying about synchronised monetary weakness, which is ringing alarm bells about economic prospects for later in 2018.
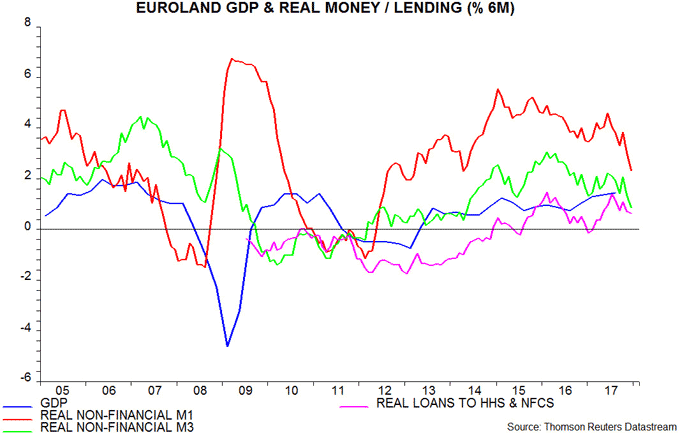
Euroland money numbers for December released today were soft. Six-month growth of real narrow money – defined as non-financial M1 deflated by consumer prices – fell further to its lowest level since 2014. Real broad money growth also declined sharply – see first chart.

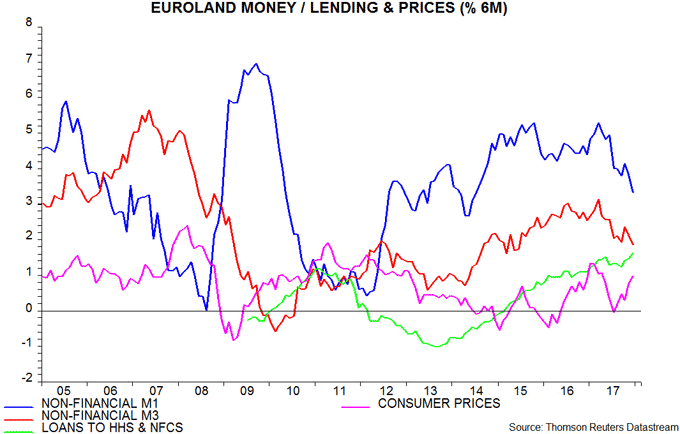
The real money slowdown reflects both lower nominal monetary expansion and a rise in six-month inflation. Six-month growth of nominal narrow money was also the lowest since 2014 last month – second chart.

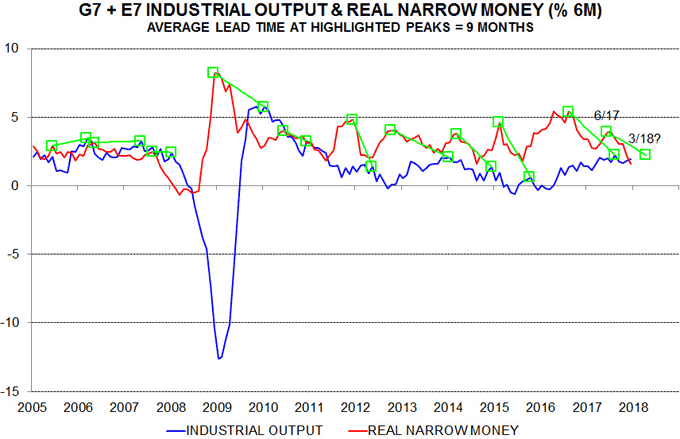
Six-month real narrow money growth also fell further in December in the US, China and Japan. Our “global” measure covering the G7 and seven large emerging economies appears to have reached the bottom of its range since 2009 – third chart*.

Global six-month real narrow money growth peaked most recently in June / July 2017 and has led turning points in industrial output growth by nine months on average in recent years (and over the longer term). This suggests a loss of economic momentum in the second quarter of 2018 extending well into the second half.
Weaker global monetary trends reflect significant US and Chinese policy tightening since late 2016. QE tapering by the ECB and BoJ, meanwhile, has slowed capital outflows and boosted the euro and yen – earlier currency falls played a key role in generating current Euroland / Japanese economic “strength”.
Will US tax cuts head off or mitigate a loss of global economic momentum? A significant stimulatory impact would probably be signalled by a rebound in US narrow money growth in early 2018. A negative view will be maintained here barring such a reversal.
*December monetary figures are available for countries accounting for 83% of the G7 plus E7 aggregate.
Is the UK labour market overheating?
Rising UK labour shortages seem to be feeding through to faster pay growth, supporting the arguments of MPC hawks such as Michael Saunders and suggesting shortening odds of an early further increase in interest rates.
The number of full-time employees rose by a very strong 0.9% in the three months to November, to stand 2.3% higher than a year before. Solid expansion had been suggested by an earlier increase in job vacancies, which climbed further in the three months to December.
The job openings or vacancies rate* of 2.9% is the highest on record in data extending back to 2001.
The CBI quarterly industrial trends survey released this week reported the highest percentages of firms experiencing shortages of general and skilled labour since 2004 and 1974 respectively – see first chart.

As well as strong labour demand, rising shortages reflect a smaller inflow of workers from the rest of the EU. Annual labour force growth, however, is only slightly below its average in recent years – second chart.

The unemployment rate was stable at 4.3% in the three months to November but a wider measure of underemployment including involuntary part-timers and those inactive but wanting a job fell further, to a new low in data back to 1992 – third chart.

Average weekly regular earnings of private sector employees rose by 2.5% from a year before in November, unchanged from October, but a three-month moving average grew by an annualised 3.5% in the latest three months – fourth chart. The average number of hours worked per week, moreover, has fallen recently, implying a stronger increase in hourly earnings. The earnings numbers continue to understate labour cost expansion because of rapidly-rising pension contributions and the apprenticeship levy.

*Vacancies as a percentage of employees plus vacancies.
UK public finances still surprising positively
UK public sector net borrowing is on course to undershoot the Office for Budget Responsibility’s £49.9 billion forecast for 2017-18, partly reflecting resilient tax receipts – consistent with the assessment here that economic growth is holding up.
12-month rolling borrowing fell to £39.4 billion in December, the lowest since January 2008 – see first chart. The December number was flattered by a one-off £1.2 billion credit from the EU, and the OBR expects self-assessment tax receipts over the remainder of 2017-18 to be significantly weaker than a year earlier – such receipts are forecast to fall by £3.1 billion for the year as a whole. Even so, the OBR appears to have been much too pessimistic about borrowing prospects in its November assessment – again.

Central government taxes and national insurance contributions rose by 4.2% in the first nine months of 2017-18 from a year before versus the OBR’s forecast of a 2.8% full-year increase – likely to be overshot even incorporating the projected decline in self-assessment receipts. Year-on-year growth of taxes and NICs has moved sideways since spring 2017, suggesting stable nominal GDP expansion – second chart.


