Entries from December 10, 2017 - December 16, 2017
Chinese money trends suggesting stable outlook
Chinese monetary and regulatory policy tightening in 2017 has raised fears of a sharp economic slowdown in 2018. Monetary trends do not currently support such worries. Narrow and broad money measures are rising at a pace consistent with moderate nominal economic expansion*. An easing of inflationary pressures could allow the authorities to step off the policy brakes in the first half of 2018, assuming that the currency remains stable.
Policy was tightened from late 2016 to cool excessively strong nominal economic growth and discourage capital outflows, which were threatening currency stability. Six-month growth rates of narrow and broad money fell significantly through spring 2017, with this slowdown subsequently reflected in a moderation in nominal GDP expansion – see first chart.

Narrow money growth has fallen slightly further in recent months but remains at a respectable level by historical standards and far above levels reached in late 2014 / early 2015, ahead of significant economic weakness. Broad money growth was worryingly low in the summer but has recovered to match narrow money expansion.
Based on these trends, previous posts (e.g. here) suggested that nominal GDP expansion would stabilise in late 2017 / early 2018. November activity and price data are consistent with this forecast: the product of industrial output and producer prices is a rough proxy for nominal GDP and its growth has revived since the summer – second chart.

Annual narrow money growth leads trends in annual growth of house prices, industrial profits and producer prices – third chart. With money growth still cooling, house prices are likely to slow further in the first half of 2018, while producer price inflation should moderate. The authorities may respond by partially reversing recent policy tightening, assuming that the balance of payments position remains stable. Such a reversal could support commodity prices despite restrained economic expansion.

*The preferred narrow and broad money measures are M1 plus household demand deposits (referred to here as true M1) and M2 minus financial sector deposits plus bank bonds. The exclusion of household deposits from the official M1 measure suggests that it will not adequately reflect consumer spending prospects. Financial sector M2 deposits have shown significant volatility in recent years but appear to contain little information about near-term economic prospects. A switch out of time deposits into bank bonds, meanwhile, may have depressed M2 growth.
Simple forecasting rule suggesting stable UK growth
A simple forecasting rule-of-thumb based on money growth and share prices is giving a neutral message for 2018 economic prospects.
The forecasting rule classifies the outlook for GDP growth in the following calendar year as good, bad or average depending on whether December levels of real (i.e. inflation-adjusted) money growth and share prices are higher or lower than 12 months earlier. Real money growth is measured by the annual rate of change of the broad M4ex measure deflated by the retail prices index excluding mortgage interest (RPIX). Share prices are measured by the FTSE local UK index, constituents of which derive at least 70% of sales from the UK and the rest of Europe, again deflated by the December RPIX*.
Annual GDP growth averaged 2.3% in the 51 calendar years from 1966 to 2016. The forecasting rule gave a “double-positive” signal for 16 of these years (i.e. both real money growth and share prices at the end of the prior year were higher than 12 months before). GDP growth in these years averaged 3.8%.
There were, by contrast, 11 years for which the forecasting rule gave a “double-negative” signal. Growth in these years averaged just 0.3%. In the remaining 24 years for which the money supply and share prices gave conflicting signals, GDP expansion averaged 2.3%, in line with the long-term mean.
The rule has continued to perform respectably in recent years. A double-negative warning was given at end-2008 ahead of a 4.2% GDP slump in 2009. A double-positive at end-2012, meanwhile, signalled that growth would pick up significantly in 2013 – contrary to prevailing angst about a double-dip recession.
The rule suggested that 2017 would be an average year: real M4ex growth rose from 2.5% to 4.5% between December 2015 and December 2016 but real share prices fell by 10.4% – the FTSE local UK index, unlike the FTSE 100 and all-share indices, did not enjoy a currency-driven “Brexit bounce”**. The average GDP growth outcome historically for this combination was 1.9%. The current consensus estimate of 2017 GDP growth is 1.6% – below the average but above a consensus forecast of 1.2% in December 2016***.
The rule is also giving a neutral message for 2018, although this will not be confirmed until late January, when December monetary data are released. As of October, annual real M4ex growth had fallen to zero, from 4.5% in December 2016 – see chart. The average level of the FTSE local UK index so far in December, meanwhile, is 4.3% higher than in December 2016. Assuming that annual RPIX inflation in December is equal to or lower than its November level of 4.0%, therefore, real share prices are on course for a marginal annual gain.
The average GDP growth outcome historically for the combination of negative monetary and positive share price signals was 2.4%. The current consensus forecast for 2018 is significantly weaker, at 1.4%.
A double-negative combination is still possible, though unlikely. The FTSE local UK index would need to average 2% less than yesterday’s level (13 December) over the remainder of the month to result in a real-terms decline compared with December 2016, assuming stable RPIX inflation.
*The FTSE local UK index goes back to 1994. The FT 30 index, which is also domestically orientated, was used for earlier years.
**Local UK stocks account for only 22% of the market capitalisation of the FTSE all-share index.
***Consensus numbers from the Treasury’s monthly survey of forecasters.
Euro at risk from distortionary ECB policy
ECB monetary policy is grotesquely misaligned with economic conditions. Monetary laxity threatens to reverse a recent strengthening of the balance of payments basic balance, suggesting euro weakness.
GDP grew by 2.6% in the year to the third quarter, mainly reflecting strength in domestic final demand, which rose by 2.3% – see first chart. Such growth is well above “potential” economic expansion estimated by the OECD, IMF and EU Commission at 1.0%, 1.3% and 1.4% respectively in 2017.
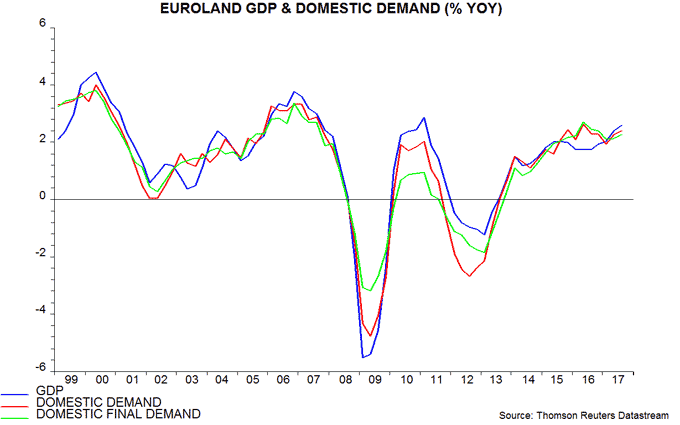
Sustained solid growth of domestic final demand since 2014 – before the ECB embarked on QE – contrasts with an anaemic recovery in 2010-11 after the 2008-09 recession. ECB policy tightening in 2011 was clearly premature and resulted in another recession. This mistake was corrected in 2012-13 under incoming ECB President Draghi – narrow money growth surged, signalling the economic pick-up from 2014.
The subsequent move to negative rates combined with large-scale QE was not warranted by monetary trends and may have overinflated asset prices while laying the foundation for a medium-term inflation overshoot.
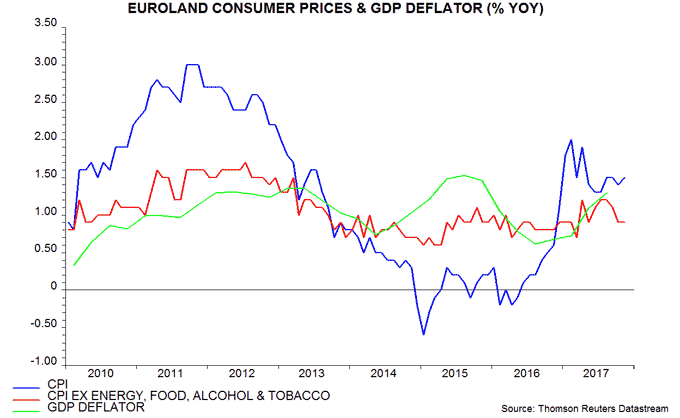
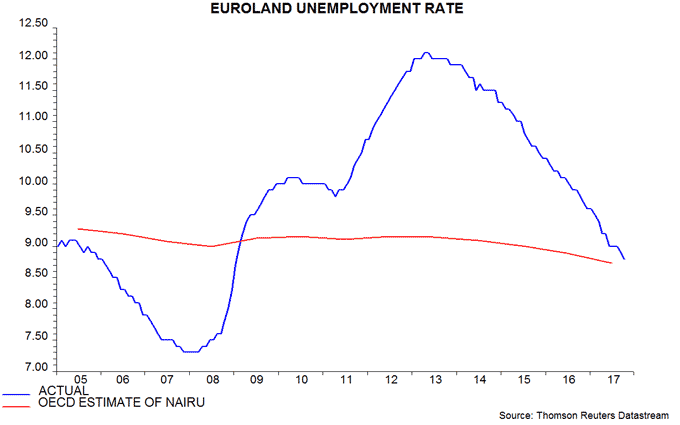
The annual increase in the GDP deflator, a broad measure of domestic prices, rose to 1.3% in the third quarter from 0.6% a year earlier – second chart. A similar pick-up in 2014-15 was aborted by pass-through of lower energy costs against the backdrop of a weak labour market. Input cost pressures are currently the strongest since 2011, according to the November purchasing managers’ survey, while labour market slack has fallen significantly since 2015 – third chart.
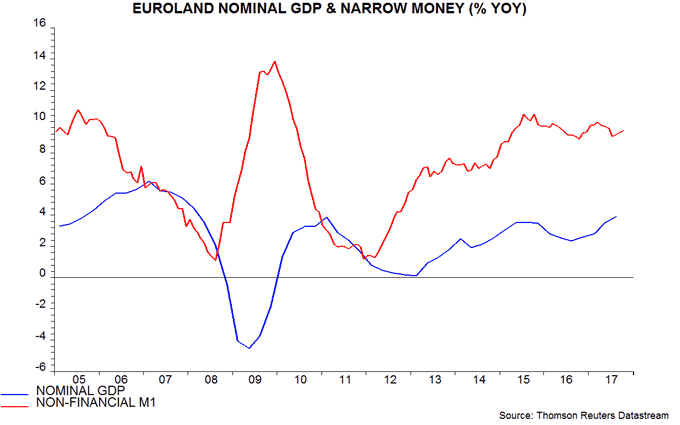
Annual nominal GDP growth moved up to 3.9% in the third quarter, the equal highest since 2008. Stable, strong narrow money growth suggests that nominal GDP will continue to expand robustly – fourth chart. Current growth, if sustained, would imply a rise in inflation to 2.5% or more over the medium term, assuming potential economic expansion of 1.0-1.4% per annum.
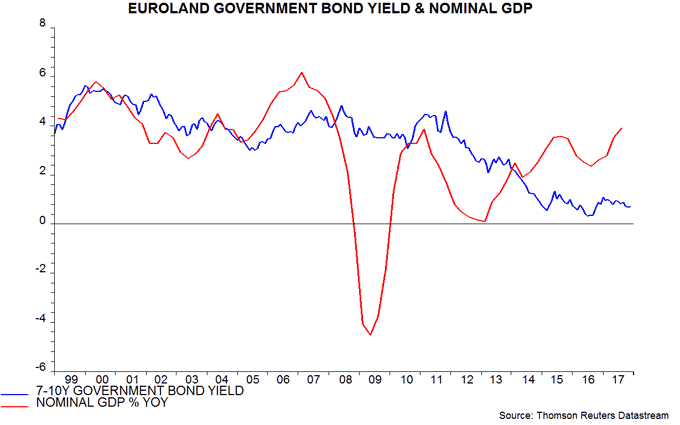
The rise in nominal GDP growth has opened up a record 3.2 percentage point gap with a debt-weighted average of Euroland 7-10 government bond yields, which have detached from economic reality because of negative rates and QE – fifth chart.
A post in January suggested that the euro, yen and renminbi would rise against the US dollar in 2017, reflecting a narrowing of balance of payments basic balance deficits. The basic balance is the sum of the current account balance and net direct and portfolio investment flows. The Euroland and Chinese basic balance deficits have indeed fallen, while Japan’s balance has moved into surplus.
According to monetary theory, the basic balance position is determined by the difference between domestic credit expansion (i.e. the growth of bank lending to the domestic public and private sectors) and growth in domestic residents’ demand to hold bank liabilities (i.e. broad money plus non-monetary liabilities such as bank bonds). Faster expansion of domestic credit than demand to hold bank liabilities creates “excess” liquidity that is, in effect, exported by running a basic balance deficit.
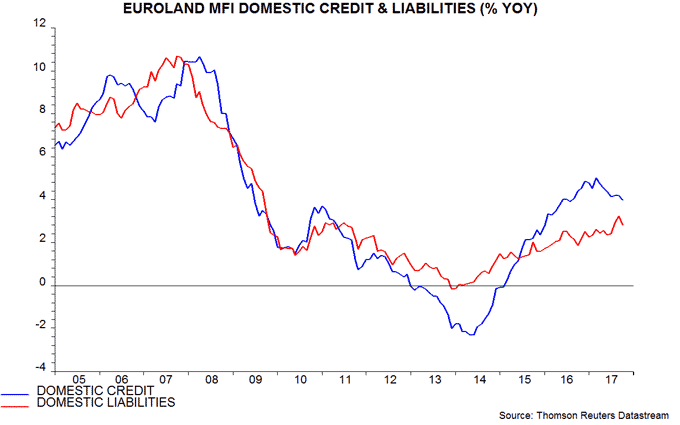
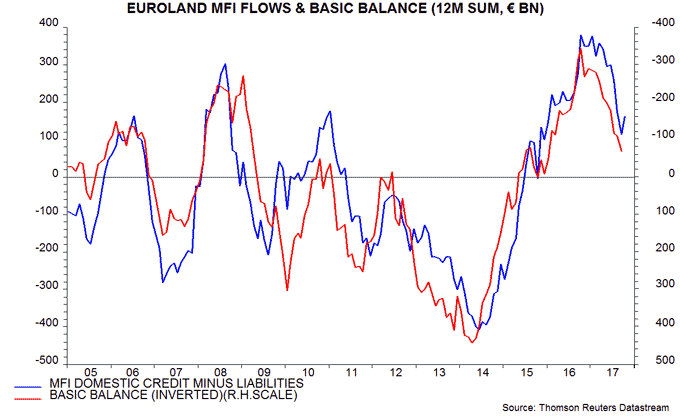
The earlier post suggested that Euroland domestic credit would slow in 2017 because of ECB QE tapering, while demand for bank liabilities would be boosted by faster nominal GDP expansion. These suggestions have played out – sixth chart. The narrower credit / liabilities growth gap “explains” the decline in the basic balance deficit – seventh chart.
Lower QE from January may result in a further reduction in credit expansion to governments but private lending growth may pick up in lagged response to current economic strength – ECB research found a 1-2 quarter average historical lag between GDP growth and real private loan expansion. The demand to hold broad money and bank bonds, meanwhile, may be depressed by the ECB’s commitment to maintain current negative rates at least through September 2018, despite rising inflation. The fall in the domestic credit / liabilities growth gap, therefore, may stall.
Relative credit / money demand trends may favour the US dollar rather than the euro in 2018. The planned reduction in the Fed’s balance sheet in 2018 is comparable in scale with the slowdown in ECB QE between 2017 and 2018, suggesting a similar drag on domestic credit expansion. US residents’ demand to hold broad money and other bank liabilities, however, may be boosted by rising nominal / real interest rates and repatriation of corporate foreign earnings due to tax reform.


