Entries from August 27, 2017 - September 2, 2017
Global money trends still positive
Monetary data released this week confirm that global six-month real narrow money growth – the key forecasting indicator employed here – stabilised in July, after picking up over March-June*. Real broad money growth has also strengthened since early 2017 – see first chart. Monetary trends, therefore, are signalling a solid global economy in early 2018.
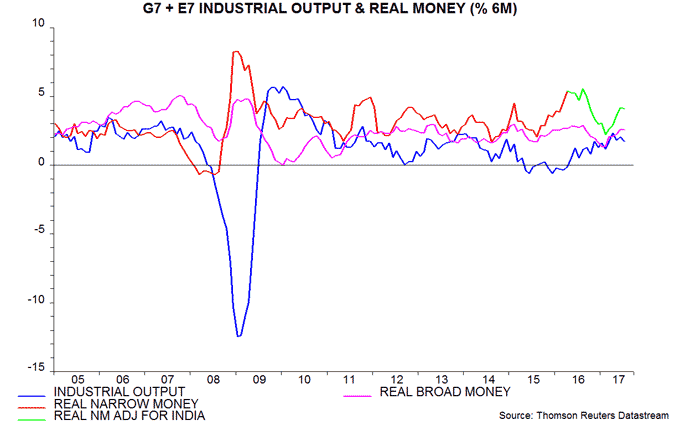
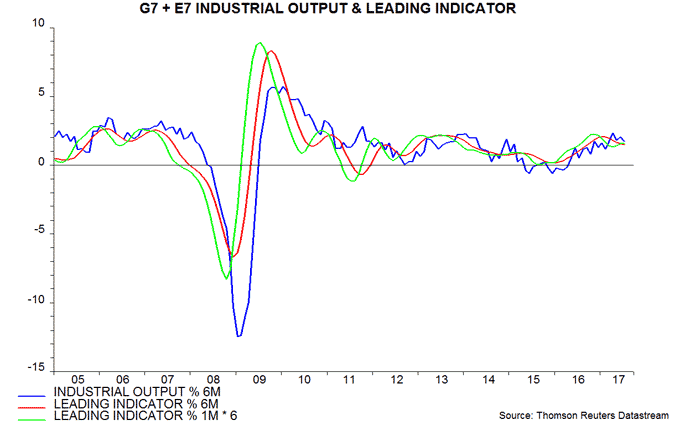
Six-month industrial output growth appears to have peaked in April, with available data suggesting a decline in July. The modest cooling since the spring is consistent with a decline in real narrow money growth in late 2016 / early 2017. The slowdown is expected here to extend slightly further before reversing in late 2017.
Such a scenario is supported by a shorter-term leading indicator derived from the OECD’s country leading indicators. Six-month growth of this indicator eased slightly further in July but one-month growth firmed for a third month, i.e. the indicator is close to confirming the monetary signal of a stronger economy from late 2017 – second chart.
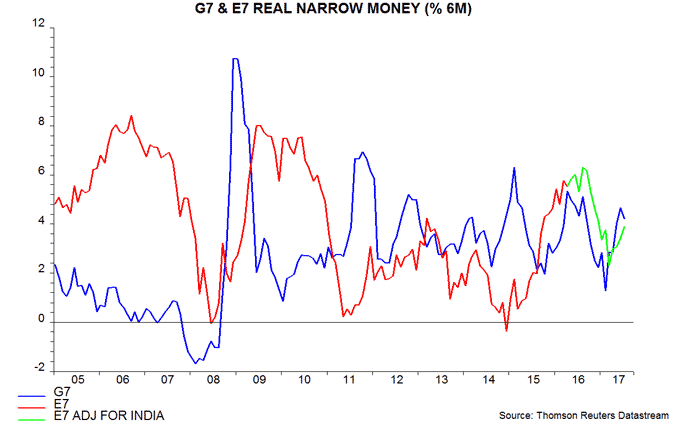
The stability of global real narrow money growth in July conceals a pull-back in the G7 offset by a further recovery in the E7 – third chart. The G7 / E7 gap, however, remains positive, suggesting slightly more favourable prospects for developed than emerging markets.
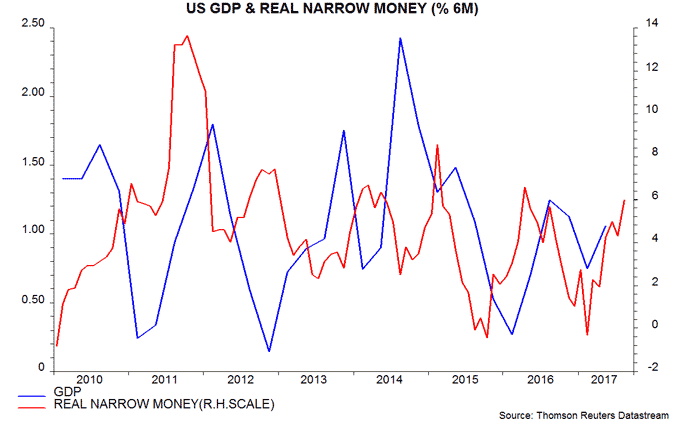
The July decline in G7 real narrow money growth may be reversed in August: US growth appears to have risen further last month, based on available weekly data – fourth chart**. The US pick-up increases confidence in the view here that the US economy will be strong in late 2017 / early 2018, with a modest near-term drag from Hurricane Harvey swiftly reversed.
*”Global” = G7 major economies and seven large emerging economies. Narrow money has been adjusted to reduce a distortion due to India’s demonetisation programme.
**Final real money growth data point = August estimate.
UK monetary trends: inflation squeeze abates
UK monetary trends have weakened over the past year but are probably consistent with GDP growth of close to trend.
The narrow non-financial M1 measure rose by 0.4% in July from June*. Annual growth slipped further to 7.2% but remains above a low of 6.6% reached in 2015 and is not far short of equivalent Euroland expansion of 8.8% – see first chart.

The broader non-financial M4 measure rose by 0.2% in July, while annual growth subsided to 4.4% – equal to a February 2015 low but close to Euroland non-financial M3 expansion of 4.6%.
Non-financial M4 understates broad liquidity expansion at present because it excludes holdings of National Savings and foreign currency deposits, which have been rising strongly – by 10% and 23% respectively in the year to July. Annual growth of an expanded aggregate – “non-financial M4+” – including these two items was 5.6% in July and has fallen by less than that of other measures over the past year.
The strong increase in foreign currency deposits may partly reflect companies switching out of sterling deposits to protect against further exchange rate weakness.
While nominal money expansion remains respectable, real-terms growth has been squeezed by higher inflation. The six-month rate of change of seasonally-adjusted consumer prices, however, subsided in June / July, driving a small recovery in six-month real money growth, in turn suggesting that economic prospects have improved at the margin – second and third charts.


The Bank of England's preferred broad aggregate, M4ex, has slowed more sharply than non-financial M4 over the past year – fourth chart. M4ex also excludes National Savings and foreign currency deposits but includes money holdings of “non-intermediate other financial corporations” – annual growth of such deposits plunged from 20.9% in April to 4.8% in July. This reflects unusually large monthly increases over May-July 2016 dropping from the calculation and is unlikely to have any implication for economic prospects.

*Non-financial = held by households and private non-financial corporations. M1 = notes / coin plus sterling sight deposits. M4 = M1 plus sterling time deposits, bank securities of up to five years’ original maturity and repo claims on banks.
Euroland monetary trends cooling
Euroland July money numbers were weak, suggesting that economic prospects are deteriorating at the margin.
Non-financial M1 – the monetary measure with the strongest historical forecasting record, according to ECB research – was unchanged in July from June, while the broader non-financial M3 aggregate fell by 0.1%*.
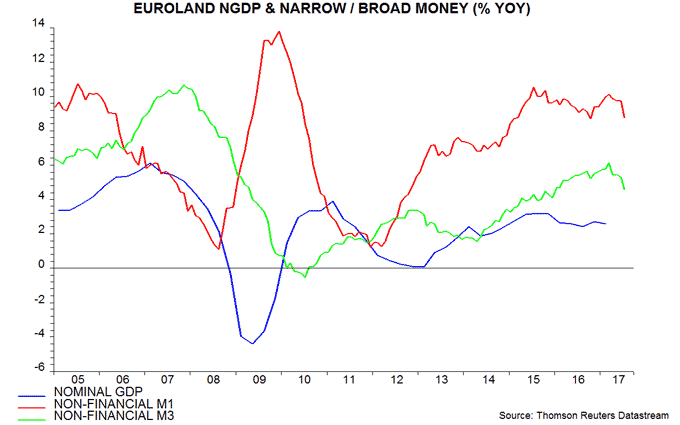
Annual non-financial M1 growth of 8.8% in July was the lowest since October 2016; non-financial M3 growth of 4.6% was the lowest since December 2015 – see first chart.
Six-month growth of the two aggregates has plunged since March: the declines between March and July were the largest over a four-month period since 2010 – second chart.
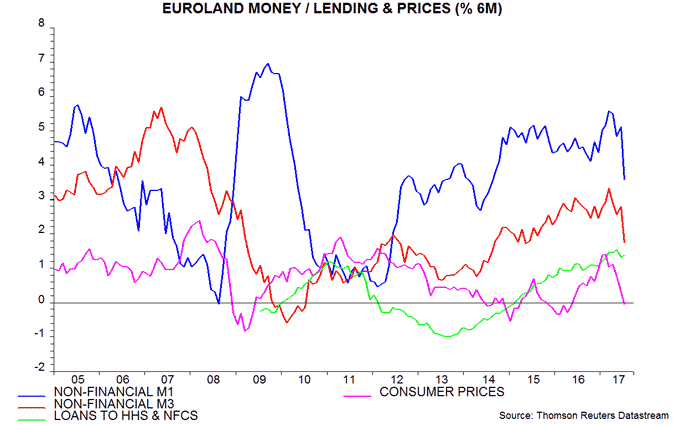
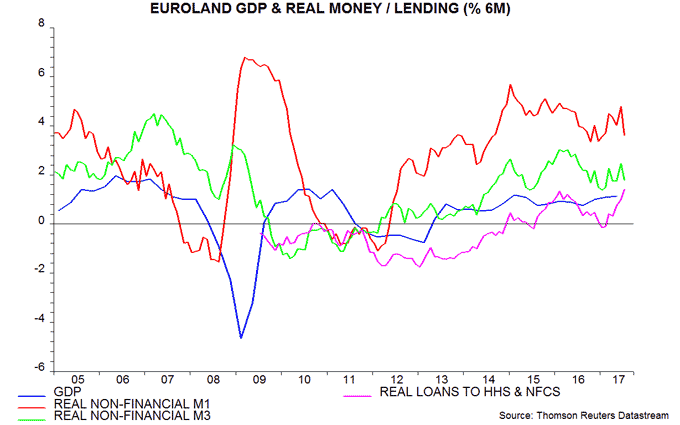
The impact on six-month real money expansion has been cushioned by a parallel sharp slowdown in headline consumer prices, reflecting the unwinding of a boost from energy and food prices in late 2016 / early 2017 – second and third charts. Real money growth, however, has pulled back sufficiently to suggest a slowing of economic momentum in late 2017 / early 2018. Six-month inflation, moreover, is likely to rebound, so real money trends may weaken further.
The headline M1 and M3 measures have slowed by less than the non-financial aggregates tracked here, reflecting relative strength in money holdings of financial corporations. Such holdings, however, are of little relevance for judging near-term prospects for spending on goods and services.
Six-month real narrow money growth was higher in Euroland than the US in late 2016, signalling superior Euroland economic prospects. The gap closed in May and the US was back ahead in July – fourth chart.

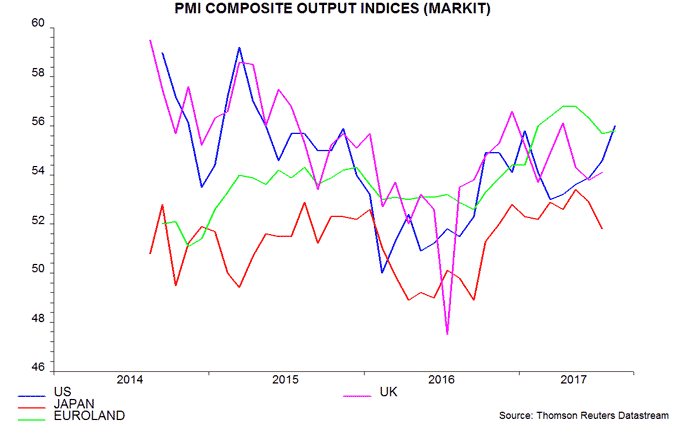
August PMIs are consistent with the forecast that the US will resume growth leadership: the US composite output index rose to its highest since May 2015, overtaking the Euroland index – fifth chart.
*Non-financial = held by households and non-financial corporations.

