Entries from August 13, 2017 - August 19, 2017
UK labour market report scores for MPC hawks
UK inflation and labour market data support the case for an early rise in interest rates, in the judgement here.
Headline and core consumer price inflation were unchanged at 2.6% and 2.4% respectively in July, against expectations of rises to 2.7% and 2.5%. Both are still heading higher, however, and the July results do not suggest an undershoot of the latest Inflation Report forecast.
Core prices (i.e. excluding energy, food, alcohol and tobacco), seasonally adjusted, have risen by an average 0.2% per month in the first seven months of 2017. The average increase over August-October 2016 was only 0.1% per month. A continued gain of 0.2% per month, therefore, would imply a rise in 12-month core inflation to 2.7% by October.
The headline / core gap, meanwhile, is likely to remain positive and may widen as food inflation – 2.9% in July, the highest since 2013 – rises further. CPI food inflation is unusually low relative to producer output price inflation of food products, of 5.8% in July.
With a rise from July’s 2.6% (2.63% before rounding) likely in August / September, headline inflation is on track to meet or exceed the MPC’s forecast of 2.68% in the third quarter in the August Inflation Report.
Today’s labour market report, on balance, scores for the MPC hawks. The Inflation Report predicted that the unemployment rate would fall to 4.4% in the second quarter and stabilise during the second half. The decline to 4.4% was delivered but the single-month estimate dropped to 4.2% in June, suggesting a third-quarter undershoot – see first chart.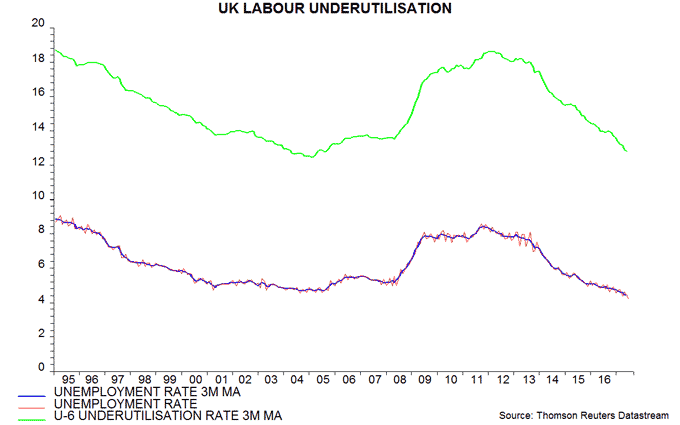
A wider measure of labour underutilisation encompassing involuntary part-time and discouraged workers continues to fall rapidly, reaching its lowest level since 2005 in the latest three months – first chart.
Earnings data surprised positively, with annual growth of total pay per employee firming to 2.1% in the three months to June from 1.9% in May (orginally reported at 1.8%).
For inflation control purposes, earnings growth should be assessed relative to productivity performance. Whole-economy output per hour fell by 0.1% in the year to the second quarter, according to a flash estimate also released today. Unit wage cost growth, therefore, appears to have moved above 2% last quarter.
Annual growth in aggregate earnings (i.e. average earnings multiplied by the number of employees) rose to 3.4% in the three months to June, as employment expansion remained solid at 1.2%. Aggregate earnings, therefore, continue to outpace consumer prices, supporting consumption prospects – second chart.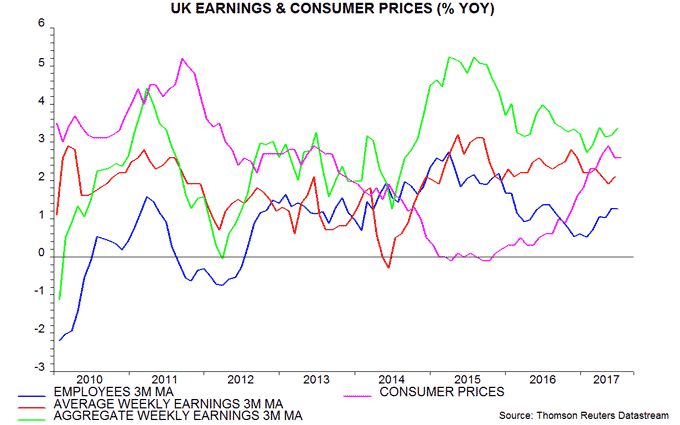
A minor weak point in the report was a fall in vacancies, suggesting that employment growth will cool during the second half – third chart. The decline, however, would need to extend to suggest a reversal of recent labour market strength.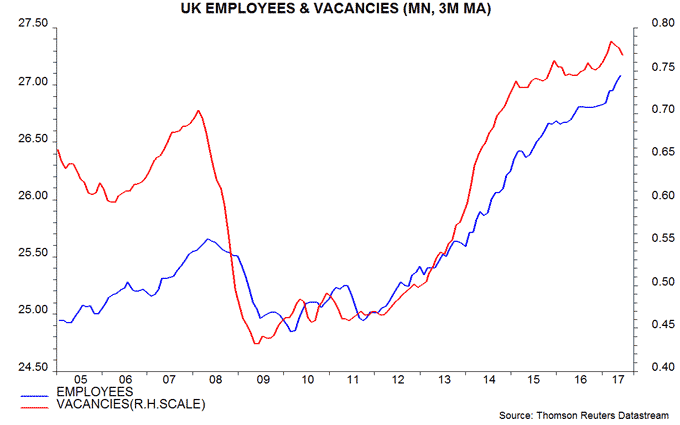
Chinese money trends suggesting economic resilience
A softening of Chinese economic activity data in July probably reflects pay-back for strong June results, as well as disruption from high temperatures / drought in parts of the country. Monetary trends suggest that economic growth will remain respectable during the second half.
Six-month growth of industrial output* reached a three-year high in June before falling back in July. The July reading, however, was close to the average since 2014 – see first chart.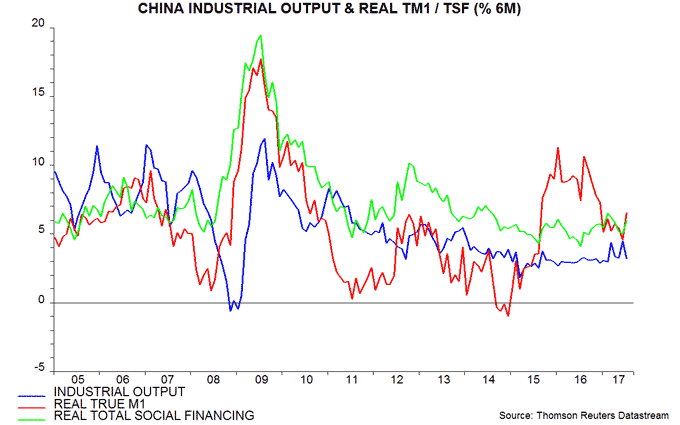
The preferred monetary aggregate for forecasting purposes here is “true” M1, comprising currency in circulation and demand deposits of corporations and households. (The official M1 measure excludes household deposits.) Six-month growth of real (i.e. consumer price inflation-adjusted) true M1 fell significantly between August 2016 and early 2017, suggesting softer economic momentum from the spring, allowing for an average nine-month lead. Growth, however, has remained above levels associated with economic weakness historically and rebounded in July – first chart.
Credit trends, meanwhile, appear consistent with the official aim of clamping down on speculative lending while maintaining "real economy" funding. Six-month growth of real total social financing of households and non-financial enterprises has fluctuated in a narrow range and was slightly above the average since 2014 in July – first chart. There has, however, been a significant slowdown in bank lending to financial institutions and government.
The rebound in six-month real true M1 growth in July reflected both a recovery in nominal expansion and a sharp decline in six-month consumer price inflation.
Pessimists argue that first-half policy tightening will exert an increasing drag on the economy during the second half. The rise in money market interest rates, however, has yet to feed through to a significant increase in bank lending rates – second chart. On the fiscal side, the central government deficit has been stable while annual growth in fixed asset investment in newly-started projects rebounded strongly in June / July – third chart.
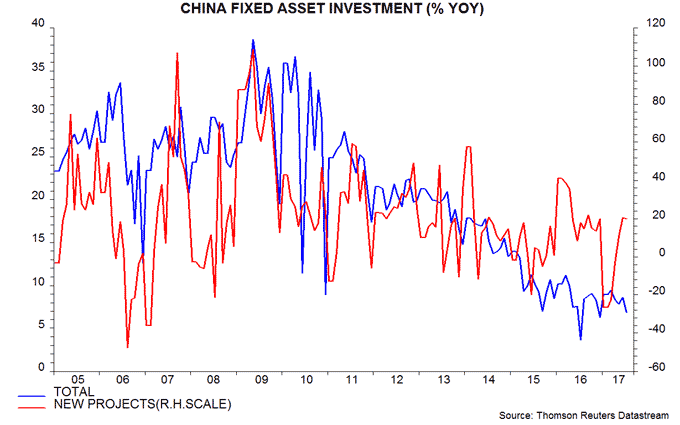
Money rates have subsided since June, with easing inflation and currency stability giving the PBoC scope to engineer a further decline, if necessary.
A constructive economic view will be maintained here barring a further slowdown in real true M1 growth.
Commentary on China is biased towards negativity, playing down or ignoring positive surprises. A recent rise in the NBS consumer expectations index to its highest level since 1993, for example, has received little attention – fourth chart.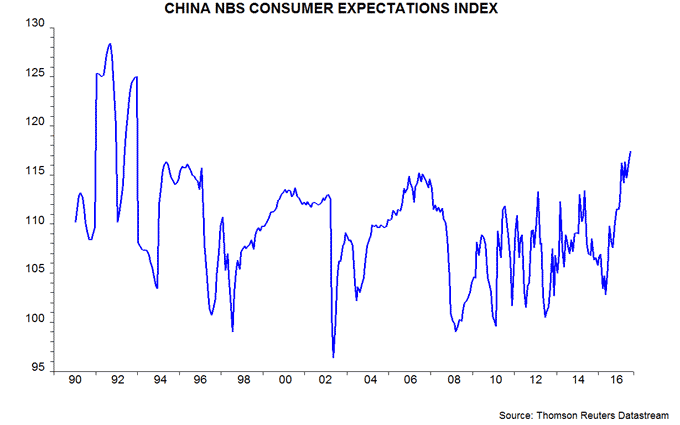
*Seasonally adjusted series sourced from World Bank.

