Entries from August 6, 2017 - August 12, 2017
US banks turning expansionary, supporting economic optimism
The Fed’s July survey of bank loan officers supports the view here that the US economy is regaining momentum and may prove stronger than the central bank and consensus expect in late 2017 / early 2018.
The basis for this forecast is a sharp rebound in six-month growth of real (i.e. inflation-adjusted) narrow money from a low in February. Turning points in real narrow money growth have consistently led those in GDP growth in recent years – see first chart.
As previously discussed, the hypothesis here is that the fall in real narrow money growth in late 2016 / early 2017 and subsequent rebound mainly reflect the impact of reforms to money market fund regulations implemented in full in October 2016. The reforms prompted money funds to shift their portfolios out of bank deposits and financial paper into Treasury bills, resulting in a rise in banks’ funding costs in 2016 – second chart. Banks responded by reining in their balance sheet expansion, slowing money / credit growth. The net percentage of banks tightening loan standards (i.e. an average across various loan categories) rose to its highest since 2010 in July 2016 – third chart.

The adjustment of money funds’ portfolios, however, appears to have been completed by late 2016 and banks’ funding costs have normalised in 2017. Their behaviour, therefore, has turned more expansionary – the net loan tightening percentage fell further in the latest Fed survey to its lowest since 2015.
The money fund reforms acted as an effective tightening of monetary policy in 2016, resulting in the Fed having to raise rates by less than expected. The reversal of the drag this year is boosting the economy, outweighing restraint from the Fed’s three hikes since November 2016. The Fed may need to accelerate tightening to compensate.
The Fed survey loan tightening percentage, inverted, leads annual growth of real bank loans and leases, which stabilised in the second quarter – fourth chart. The six-month change in real bank loans has recovered from -0.3% (not annualised) in February to 0.7% in June, with weekly data indicating a further rise in July.
G7 core inflation decline may reverse in H2
A fall in G7 core* consumer price inflation since early 2017 has been driven by a sharp decline in the US. The US drop reflects a combination of a large cut in wireless telephone charges and normal volatility, with the latter suggesting a second-half recovery. Core inflation, meanwhile, may firm in Euroland and Japan, and remain elevated in the UK. A rebound in the G7 core rate coupled with economic reacceleration from late 2017 – suggested by monetary trends – could force faster-than-expected monetary policy tightening.
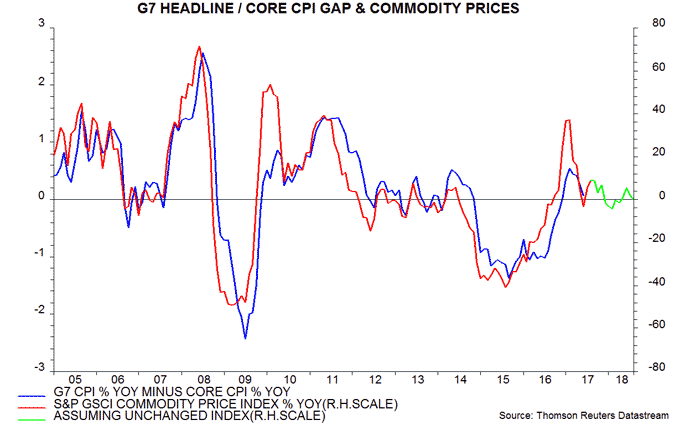
G7 headline consumer price inflation peaked at 2.0% in February and fell to 1.4% in June. The decline was mainly due to a reduced boost from food and energy prices but, in addition, core inflation subsided from 1.5% to 1.3% – first chart.

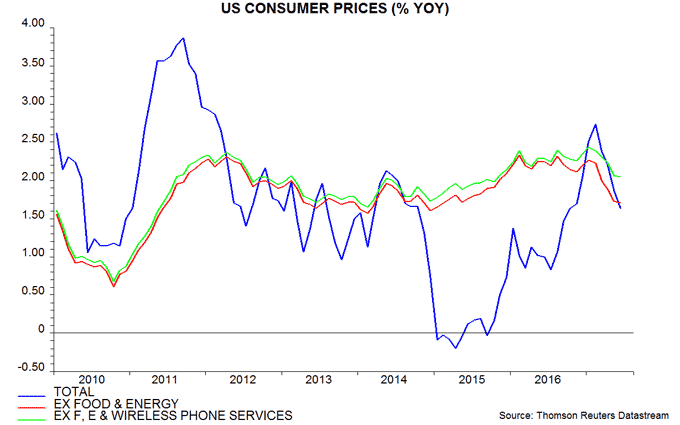
The core slowdown was driven by the US, where the core rate dropped from 2.3% in January to 1.7% in June. About one-third of this decline is attributable to a faster decline in wireless telephone charges – down by 13.2% in the 12 months to June versus 4.3% in January. Core inflation excluding such charges was 2.0% in June – second chart.

The remainder of the US core decline probably reflects normal volatility. The three-month change in core prices, seasonally adjusted and annualised, has fluctuated around a mean of 1.9% since 2005, with departures from this level usually short-lived and followed by an opposite deviation – third chart. (The exception was a sustained shortfall in the immediate aftermath of the 2008-09 recession.) The three-month change spiked up to 3.0% in February but has since reversed sharply lower, in line with the historical pattern but with weakness magnified by the cut in wireless charges.

The current low level of the three-month change, even excluding wireless charges, suggests that it will rebound to above the 1.9% average during the second half. A significant overshoot would push up the core annual rate (since core prices rose by an annualised 2.1% during the second half of 2016).
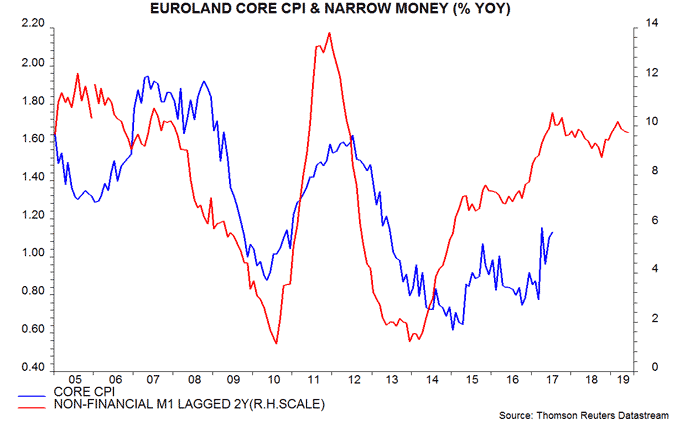
Euroland core inflation has firmed from 0.9% in December to 1.2% in July and may rise further as upward pressure from above-trend economic growth, reflecting earlier monetary strength, outweighs a drag from recent euro appreciation – fourth chart.

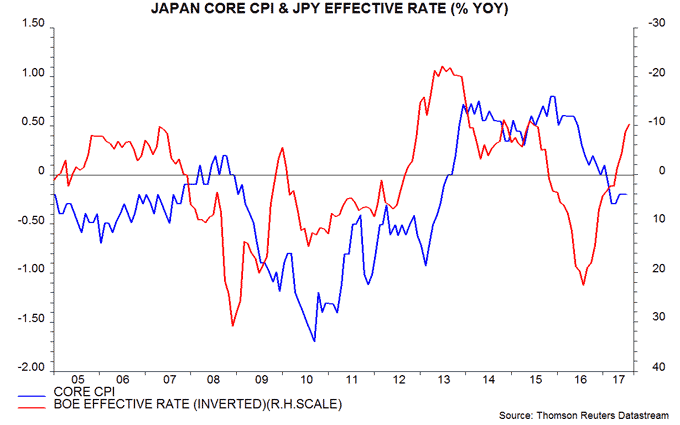
The Japanese core rate, meanwhile, may recover as a drag from yen strength into August 2016 is replaced by a boost from subsequent depreciation – fifth chart.

A recovery in G7 core inflation would probably push the headline rate back up, assuming that commodity prices of food and energy are stable at around current levels: the relationship with the annual change in commodity prices suggests that the headline / core gap will rise near term before turning slightly negative around year-end – sixth chart.

*”Core” = excluding food and energy. Japanese measure also adjusted for 2014 rise in consumption tax.

