Entries from July 9, 2017 - July 15, 2017
US ISM strength: signal or "head fake"?
A rise in the US ISM manufacturing purchasing managers’ index to a 34-month high in June, reported last week, presents a challenge to the view here that global economic momentum peaked in spring 2017 and will moderate into the fourth quarter. The ISM PMI is widely regarded as a reliable gauge of global as well US industrial activity; indeed, it exhibits a slightly higher correlation with global than US industrial output growth*.
A provisional judgement is that the ISM surge is a reflection of earlier economic strength and will be swiftly reversed. This is supported by three observations.
First, the forward-looking new orders component of the PMI, while rising sharply in June, remained below its level in February / March.
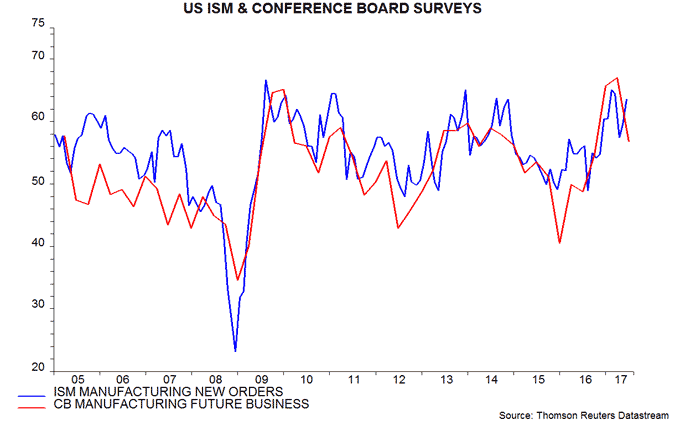
Secondly, the ISM surge is at odds with the Conference Board CEO confidence survey for the second quarter, also released last week, which reported weaker business expectations among manufacturers. The CEO expectations measure usually aligns with the trend in ISM new orders – see first chart.
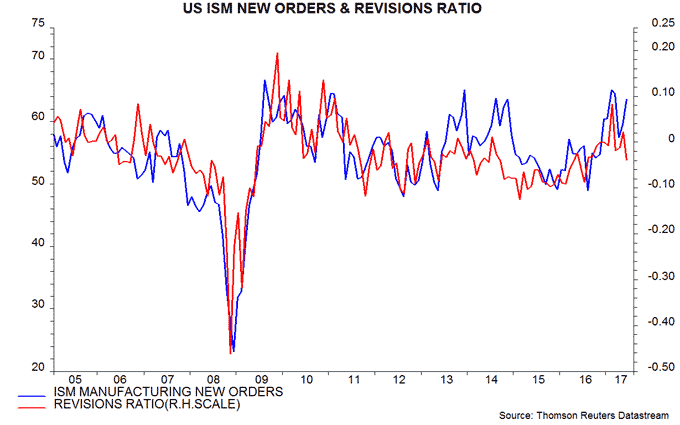
Thirdly, the ISM result also contrasts with a fall in the IBES US equity analysts’ earnings revisions ratio in June, to an 11-month low. A rise in the revisions ratio in May had suggested that ISM new orders would rebound in June – second chart.
As previously discussed, the global slowdown is expected to be modest and temporary, with money trends now signalling economic reacceleration in late 2017. Near-term negative economic surprises may focus on Euroland, partly reflecting consensus over-optimism.
*Contemporaneous correlation with six-month industrial output growth over 1996-2016: global (i.e. G7 plus E7) +0.77, US +0.71.
UK labour market strength adds to pressure on MPC
The UK labour market tightened further last quarter, consistent with the view here that the economy has retained momentum and strengthening the case for a “pre-emptive” rise in interest rates, despite continued subdued pay growth.
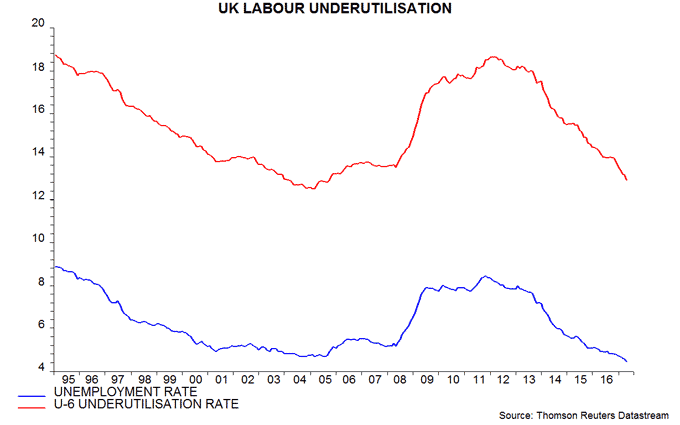
The unemployment rate fell to 4.5% over March-May, below the MPC’s forecast of 4.7% for the second quarter in the May Inflation Report and the lowest since 1975. The single-month estimate for May was 4.4%.
The unemployment rate understated labour market slack earlier in the upswing, because there were unusually large numbers of people either working part-time involuntarily or not actively seeking employment, despite wanting a job. This “hidden” margin has eroded rapidly since 2014. A broader measure* of labour underutilisation (i.e. a UK equivalent of the US U-6 rate) fell further to 12.9% over March-May, close to a 2005 low of 12.5% in the last economic upswing – see first chart. The gap between the underutilisation and unemployment rates is the smallest since 2008.
Annual growth of average weekly earnings, including bonuses, weakened further to 1.8% over March-May, the lowest since 2014. Regular earnings growth, however, ticked up to 2.0%. Private-sector regular growth was 2.2% over March-May and 2.4% in May alone, a five-month high.
While overall pay trends remain subdued, the MPC’s assessment will also take into account recent weaker-than-expected productivity performance, faster growth of non-wage labour costs and a possible lifting of the 1% cap on public-sector pay increases.
Annual growth in aggregate weekly earnings (i.e. average earnings multiplied by the number of employees) was unchanged at 3.1% over March-May, supported by a further rise in employment expansion to 1.3%, a 10-month high – second chart. Aggregate earnings, therefore, are currently still just outpacing consumer prices – a contrast with the last inflation upsurge over 2009-11, when earnings lagged significantly.
*Total unemployed plus number working part-time because could not find full-time job plus number inactive but wanting a job, expressed as % of labour force plus number inactive but wanting a job.
More caveats to UK consensus economic gloom
UK monetary trends signal that economic prospects have deteriorated but consensus gloom may have become exaggerated again.
Economists now expect the preliminary second-quarter GDP release on 26 July to report quarterly growth of only 0.2-0.3%. This partly reflects weak industrial and construction output data for May – the average levels of output in April / May were 0.5% and 1.6% respectively below their first-quarter averages.
Services output in April, however, was 0.4% above the first-quarter average and turnover data – ignored by most economists – suggest a respectable monthly increase in May. The official GDP estimate is likely to incorporate a projection of further growth in June. Services output, therefore, may be reported to have risen by 0.6% last quarter. With the sector accounting for 79% of GDP, this would suggest overall growth of 0.4% despite industrial / construction weakness – in line with the Bank of England staff’s estimate at the time of the June MPC meeting.
Gloom about consumer spending prospects was magnified by news of a fall in the household saving ratio to a record low. As previously discussed, however, the official saving ratio measure is at odds with other data indicating respectable household accumulation of financial and capital assets.
The official approach measures saving as the difference between disposable income and consumption. An alternative approach is to measure it as new investment in financial and capital assets minus borrowing. Based on the alternative approach, the saving ratio was 7.2% in the year to the first quarter versus only 4.2% for the official measure – see first chart.
The two measures are conceptually equivalent so the difference must reflect measurement error. One possibility is that the official statistics understate income, perhaps reflecting the increasing difficulty of tracking compensation as working patterns change.
According to the official data, household real disposable income fell by 1.4% in the year to the first quarter. The June EU Commission consumer survey, by contrast, reported that a balance of only 2.3% of households judged their finances to have deteriorated over the past 12 months – significantly better than the long-run average (since 1990) of 8.5%.
Pessimistic forecasters argue that a consumer slowdown will be compounded by weakness in business investment. Real* disposable income of private non-financial corporations (PNFCs), however, rose by 20.6% in the year to the first quarter, following a decline in late 2015 / early 2016 – second chart. This pick-up accords with recent stronger corporate money trends, suggesting that a first-quarter recovery in investment will be sustained.
*Real = deflated by GDP deflator.
