
Entries from June 11, 2017 - June 17, 2017
Some caveats to consensus UK economic gloom
 Simon Ward
 Post a Comment
Recent UK data and the election result have increased pessimism about economic prospects. A sober view is warranted but not all recent news has been negative.
Industrial and construction output numbers for April, released last Friday, were weak – 0.4% and 1.5% respectively below first-quarter averages. This caused analysts to scale back forecasts for second-quarter GDP growth.
An accompanying report, however, on services turnover was more encouraging, though received little attention. The turnover survey is an important input to services output, for which an April number will be released on 30 June. Adjusted for seasonals and estimated inflation, turnover rose solidly in April – see first chart. 
The retail sector is not covered by the turnover survey. It will contribute +0.17 percentage points (pp) to the monthly change in services output in April, since retail sales volume rose by 2.5% and retailing has a 7.1% weight. (There will be a -0.08 pp contribution in May, based on yesterday’s news that sales volume fell by 1.2% last month.)
A monthly rise in services output of as much as 0.5% in April does not look unreasonable based on these indications. If realised, the implied level of GDP in April – taking into account the weak industrial and construction data – would be 0.4% above the first-quarter average. GDP, that is, would be on course to expand respectably in the second quarter, following first-quarter growth currently reported at only 0.2%.
Negative commentary has also focused on this week’s news of an intensifying real wage squeeze, with consumer price inflation up to 2.9% in May but annual growth of average weekly earnings down to 2.1% in the three months to April – second chart.
Aggregate employee earnings, however, are still rising faster than prices, reflecting solid growth in employee numbers – up by 1.0% in the three months to April from a year before. Aggregate earnings rose by an annual 3.1% in the latest three months. They lagged prices significantly during the last inflation spike in 2011, when employee numbers fell.
Monetary trends are signalling a second-half economic slowdown, with six-month growth of real narrow money falling since late 2016 – third chart. The corporate component, however, is holding up, suggesting that businesses still expect to increase investment and jobs; corporate (i.e. PNFC*) real narrow money has contracted before recessions historically. The drag from consumer spending weakness, meanwhile, may be partly cushioned by a slowdown in imports.
*PNFC = private non-financial corporations.
Global money trends suggesting late 2017 growth rebound
Global economic growth appears to be moderating, consistent with the forecast here of a summer slowdown from a spring peak. Monetary trends, however, are improving, suggesting that the slowdown will prove temporary and growth will bounce back in late 2017.
Evidence of a loss of momentum includes falls in the Citigroup G10 economic surprise index, which is now negative, and the MSCI World earnings revisions ratio (i.e. the net percentage of upgrades to earnings forecasts for MSCI World constituents). The revisions ratio correlates with the global (i.e. G7 plus E7) business survey indicator tracked here, which appears to have peaked in February / March and may subside further in June – see first chart. 
The forecast that the slowdown will extend over the summer, and possibly beyond, is supported by a global leading indicator derived from the OECD’s country leading indicators. Six-month growth of this indicator fell again in April, having peaked in January. Its average lead time with respect to industrial output historically has been 4.5 months, suggesting that six-month output growth is at or past a peak and will decline through August / September – second chart.
The economic slowdown was first signalled by a decline in six-month growth of global real (i.e. inflation-adjusted) narrow money from a peak in August 2016 – the average lead time from real money to output is nine months. Weakness was magnified by India’s demonetisation programme but growth fell significantly even stripping out the India drag, with the decline extending into February 2017 – third chart.
The adjusted real money growth measure, however, rebounded in March / April, with partial data suggesting a further solid increase in May. India is now boosting the headline number – M1 has retraced 80% of the demonetisation-related decline. Money trends, therefore, are signalling that the global economy will regain momentum in late 2017 / early 2018.
A strong pick-up in US real narrow money growth, discussed previously, has been the key driver of the rebound in the global measure. Japanese growth has also firmed, while Chinese growth has stabilised after moderating in late 2016 / early 2017 – fourth chart.
The US monetary turnaround casts doubt on recent commentary expressing pessimism about economic prospects based on a negative “credit impulse”. The credit impulse (i.e. the rate of change of credit growth) has had a variable relationship with economic activity historically and is typically coincident rather than leading. Commercial bank loans and leases rose in April and May after stagnating over the prior four months – fifth chart. The impulse, that is, may be turning positive, consistent with the earlier positive signal from money trends (which usually lead credit).
The main risk to the scenario of global reacceleration from late 2017 is a further slowdown in Chinese real narrow money in response to recent policy restriction, i.e. a loss of Chinese economic momentum could offset the expected US pick-up. The Fed, however, is now downplaying global developments in its policy decisions; it would be likely to proceed with its tightening plan unless Chinese cooling triggered a significant “risk-off” move in markets.
UK inflation: core surge continues
The divergence of UK and US monetary policies looks increasingly odd. Inflation and unit labour cost growth are higher in the UK than the US, while GDP growth and job market conditions are similar – unemployment and underemployment rates in both countries are close to prior-cycle lows. Brexit is negative for UK growth prospects but represents a supply as well as demand shock. Mismanagement of Brexit and a loss of fiscal discipline threaten to exacerbate sterling weakness, entrenching high inflation.
The case for a rise in UK rates is strengthened by today’s news that consumer price inflation rose further to 2.9% in May (2.87% before rounding), significantly above the 2.65% projection for the second quarter in the May Inflation Report. The forecast here remains for inflation to move above 3% during the second half.
The May increase was driven by "core" inflation. The preferred core measure here is the CPI excluding energy, food, alcohol, tobacco and education adjusted for the estimated impact of VAT changes. Core inflation rose to 2.5% (2.53%) in May, the highest since 2012 – see first chart.

Core prices increased at a seasonally adjusted annualised rate of 3.0% in the three months to May from the previous three months – second chart*. If prices were to rise at this rate over the next three months (i.e. June-August), core inflation would increase further to 2.8%, partly reflecting weak core momentum in summer 2016.

Last month's update argued that an acceleration of food prices would contribute to CPI inflation increasing further. Food inflation rose from 1.8% in April to 2.5% in May, with recent large increases in home-produced and imported food material costs suggesting a pick-up to perhaps 5-6% later in 2017 – third chart.

As previously argued, inflation is rising in lagged response to a significant increase in monetary expansion between 2011 and late 2016. The fall in the exchange rate has been part of the “transmission mechanism” from loose money to faster price rises, rather than being a primary driver. The historical evidence is that money growth peaks lead core inflation peaks by between two and three years. Assuming that annual broad money growth peaked in autumn 2016**, this suggests that core inflation will remain under upward pressure through late 2018, at least.
*Seasonally adjusted using X12 procedure.
**Annual growth of non-financial M4 reached 6.8% in September 2016, falling to 5.4% by April 2017.
US money trends still strengthening
US monetary news remains upbeat, suggesting that stronger economic growth in late 2017 / early 2018 will force the Fed to tighten by more than currently discounted.
The narrow money measure tracked here fell in the week to 29 May but is on course to rise by about 1.75% in May from April (month average basis). This would push three-month growth up to about 4% (not annualised), the fastest since May 2016 and up from zero in December – see first chart.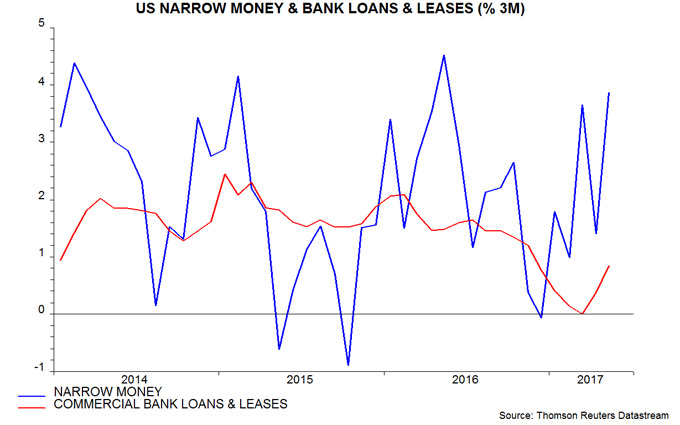
Bank lending, meanwhile, is reviving. The stock of commercial bank loans and leases rose by 0.4% in May after a 0.5% April gain, pushing three-month growth to its fastest since November.
The view here is that the earlier narrow money / lending slowdown reflected a rise in bank funding costs and an associated tightening of credit conditions caused by changes to money market fund regulations in 2016. These changes resulted in money funds reducing their lending to banks while buying Treasury and agency securities, pushing up funding spreads. Money funds reduced their holdings of bank deposits and commercial paper (CP) by $565 billion during the final three quarters of 2016, according to the Fed’s Z.1 financial accounts.
The portfolio shift appears to have been completed by end-2016, with the latest Z.1 accounts, released last week, showing a $34 billion recovery in money funds’ holdings of deposits and CP in the first quarter of 2017. An associated normalisation of funding spreads has, on the interpretation here, been a key driver of the pick-up in narrow money and credit.
Broad money, meanwhile, continues to expand robustly. The Fed stopped publishing M3 data in 2006 but a quarterly series can be derived from the Z.1 accounts. Annual growth of this measure rose to 7.5% at end-March, the fastest since 2008 – second chart.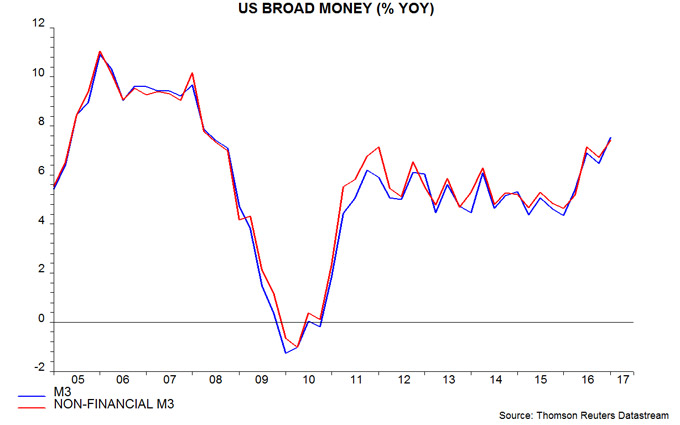
There is some confusion about broad money trends at present. The ShadowStats website produces a monthly M3 estimate and claims that annual growth was only 3.3% in April. There is, however, a problem with the ShadowStats methodology – M3 is estimated by adding large time deposits at commercial banks (among other items) to the official M2 series but these deposits include holdings of money market funds, which should be excluded to prevent double-counting (i.e. M3 should include the liabilities but not assets of money funds). As noted above, money funds have slashed their deposit holdings over the past year, resulting in the ShadowStats measure understating M3 growth.