Entries from May 21, 2017 - May 27, 2017
UK GDP slowdown exaggerated but prospects fading
UK monetary trends have been signalling an economic slowdown in the second half of 2017. Today’s downward revision to quarterly GDP growth in the first quarter to only 0.2% raises the question of whether the slowdown has already arrived. The assessment here is that first-quarter weakness partly represented payback for solid performance during the second half of 2016 and quarterly growth is likely to bounce back in the second quarter before fading later in the year.
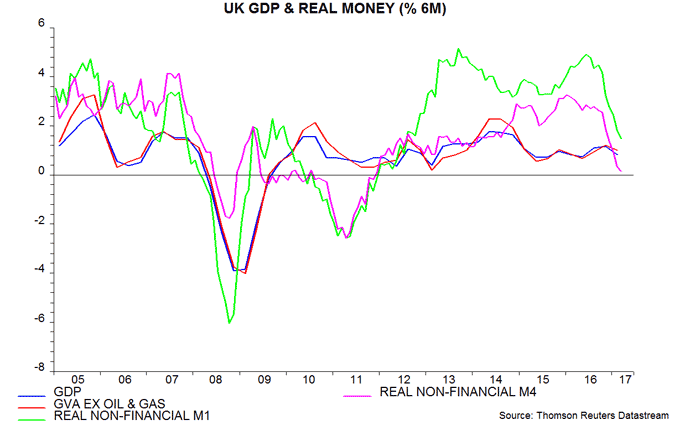
The analytical approach here focuses on six-month or two-quarter changes to assess trends in economic series, on the basis that this reduces noise while still allowing timely identification of turning points. GDP rose by 0.85%, or 1.7% at an annualised rate, in the fourth and first quarters combined. Excluding oil and gas extraction, output grew by an annualised 1.9% – equal to or above estimates of potential economic expansion*.
This respectable performance was signalled by monetary trends in the first half of 2016. Six-month growth of real narrow money – as measured by non-financial M1 deflated by consumer prices – peaked in June 2016 and remained elevated through October. Allowing for a typical nine-month lead, this suggested that economic growth would hold up through summer 2017. Real money, however, slowed sharply in late 2016 / early 2017, warning of economic weakness in late 2017 – see first chart.
The monetary forecast, therefore, implies a bounce-back in quarterly growth in the second quarter. The expenditure breakdown for the first quarter is consistent with this expectation. Domestic demand – adjusted to exclude the net acquisition of gold and other valuables – rose by 0.8% on the quarter, with a slowdown in household consumption expansion (from 0.7% to 0.3%) offset by faster growth of government consumption (0.8%) and fixed investment (1.2%). GDP expansion was depressed by a fall in net exports, which may rebound in the current quarter, partly reflecting solid global demand.
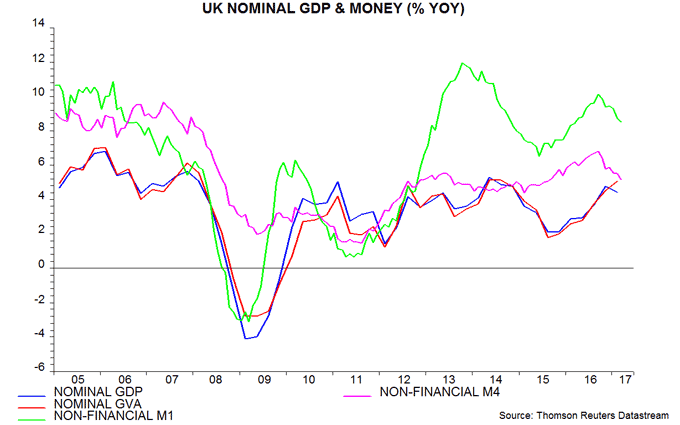
Nominal aggregates, meanwhile, continue to rise strongly, as earlier monetary strength feeds through to higher inflation. Annual growth of nominal GDP moderated to 4.4% in the first quarter but annual growth of nominal gross value added** (GVA) rose to 5.1%, the fastest since 2014 – second chart. Assuming potential economic expansion of no more than 2% per annum, nominal GDP / GVA growth needs to be limited to about 4% to be consistent with the 2% inflation target. Money trends suggest that growth is at or close to a peak.
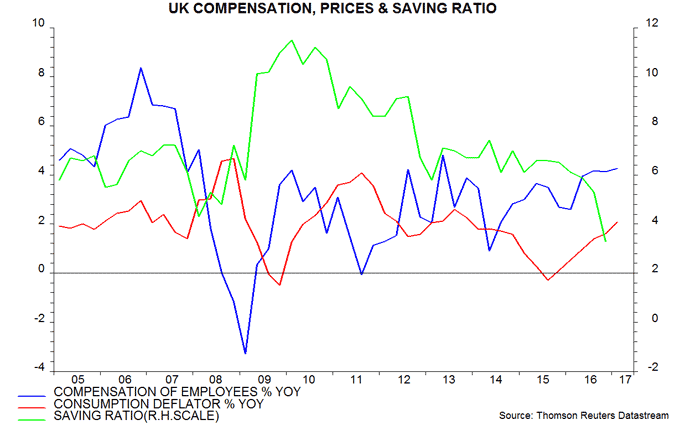
The inflation drag on consumer spending has been moderated by faster expansion of aggregate employee incomes, reflecting modestly higher average earnings growth and resilient employment trends. Annual growth of employee compensation rose to 4.3% in the first quarter, the most since 2013 and compared with a 2.1% annual increase in the price deflator for household consumption. Real compensation, by contrast, contracted during the last inflation upsurge in 2010-11; consumer spending, however, was cushioned by a fall in the saving ratio from a high post-recession level – third chart.
*2017 potential growth estimates: OBR 1.9%, IMF 1.8%, EU Commission 1.6%, OECD 1.5%.
**GVA excludes indirect taxes and subsidies.
US money / credit trends improving
A recent post argued that changes to US money market fund regulations in 2016 had a stifling impact on money and credit growth. The post suggested that this effect was starting to reverse, implying improving economic prospects for late 2017. Incoming evidence supports this hypothesis. The Fed may have to step up policy tightening to offset commercial bank-led monetary loosening.
The regulatory changes resulted in money funds switching out of bank deposits and open market paper into Treasury and agency securities. The contention is that this portfolio shift boosted banks’ funding costs, leading them to reduce credit supply, causing a slowdown in money / lending and weaker spending. Money funds reduced their holdings of time deposits and open market paper by $583 billion during the last three quarters of 2016 while buying $431 billion of Treasury and agency securities, according to the Fed’s Z.1 financial accounts.
The yield spread between three-month financial commercial paper and Treasury bills rose from an average of 9 basis points (bp) in 2014 to a peak of 46 bp in September 2016 ahead of the October implementation of the new regulations. The spread, however, has fallen sharply in 2017, averaging 16 bp so far in May. The LIBOR / overnight indexed swap spread has behaved similarly – see first chart. This suggests that money funds had completed their portfolio adjustment by late 2016 and investment flows have normalised in 2017 (the Z.1 accounts for the first quarter will be released in early June).
The fall in funding costs should, if the hypothesis is correct, boost credit supply and encourage spending. The latest money / lending data are consistent with this story. Three-month growth of narrow money has picked up from a low in December 2016, while three-month growth of commercial bank loans and leases appears to have bottomed in March – second chart*.
Bank credit tightening in 2016 capped economic strength, resulting in the Fed raising interest rates by less than expected. A reversal of the effect over the remainder of 2017 could require additional Fed tightening to prevent economic overheating. Such a scenario would suggest renewed upward pressure on Treasury yields and, possibly, the US dollar.
*Incorporates May estimates based on weekly data through 8-10 May.

