
Entries from May 14, 2017 - May 20, 2017
Global slowdown under way, latest money data slightly better
 Simon Ward
 1 Comment
The view here since late 2016 has been that global economic momentum would slow from a peak in spring 2017. The latest monetary information suggests a renewed acceleration from late 2017, although this requires additional data confirmation. The near-term slowdown is not expected to reverse recent labour market tightening so is unlikely to deflect the Fed and other central banks from continuing to rein back stimulus. This suggests a difficult backdrop for markets.
Based on partial data, six-month growth of global industrial output is likely to have risen further in April to its highest level since 2014 (“global” = G7 plus “E7” large emerging economies). Growth may decline in May, reflecting an unfavourable base effect from a large monthly output rise in November 2016. An April peak in six-month growth would be consistent with global real narrow money trends: six-month real money expansion peaked in August 2016 and has led output growth turning points by an average of nine months historically – see first chart.
Real money growth, adjusted to smooth the effect of India’s demonetisation programme, fell into February 2017, suggesting that the economic slowdown will extend into late 2017. It recovered, however, in March, with partial April data indicating a further increase. If confirmed and followed by a third successive rise in May, the view of six-month-ahead economic prospects here will shift from downbeat back to upbeat.
Markets are unlikely to start discounting a year-end pick-up for several more months. Softer economic and earnings news may dominate near term. The prospect of a summer slowdown has been confirmed by the global leading indicator tracked here, one-month growth of which appears to have fallen for a fifth successive month in April, based on preliminary calculations – second chart. (To recap, the global leading indicator is derived from the OECD’s country leading indicators and has led industrial output by four to five months on average historically.)
Business surveys, which provide little if any lead on industrial activity (though are more timely), are starting to cool on schedule. A global survey indicator combining responses on new orders or output expectations, mostly for the industrial sector, fell in April for the first time since August 2016, mainly reflecting a softer US ISM – third chart.
Major central banks are optimistic about economic prospects and concerned about inflationary risks from tight labour markets – the G7 unemployment rate is at its lowest level since 1980. They are likely, therefore, to be slow to respond to softer near-term data. Weaker economic / earnings news with an absence of offsetting policy support could challenge current equity market valuations. Yields on Treasuries and other government bonds, meanwhile, may be underpinned by QE wind-down, worries about US fiscal laxity and possible end-2017 economic reacceleration.
UK inflation: strong core pick-up, food next?
UK annual consumer price inflation rose from 2.3% in March to 2.7% in April and remains on course to move above 3% later in 2017, exceeding the MPC’s upwardly-revised central forecast (showing inflation peaking at 2.8% in the fourth quarter).
The 2.7% April reading was above a consensus forecast of 2.6% but in line with the Bank of England staff’s projection in last week’s Inflation Report.
March inflation had been suppressed by a year-on-year fall in air fares due to the later timing of the Easter holiday in 2017 compared with 2016. This effect reversed in April. Excluding air fares, CPI inflation was 2.4% in March and 2.5% in April (2.54% before rounding).
The April increase was driven by “core” inflation rather than energy / food prices. The preferred core measure here is the CPI excluding energy, food, alcohol, tobacco and education adjusted for the estimated impact of VAT changes. This rose to 2.3% in April, the highest since 2012 – see first chart.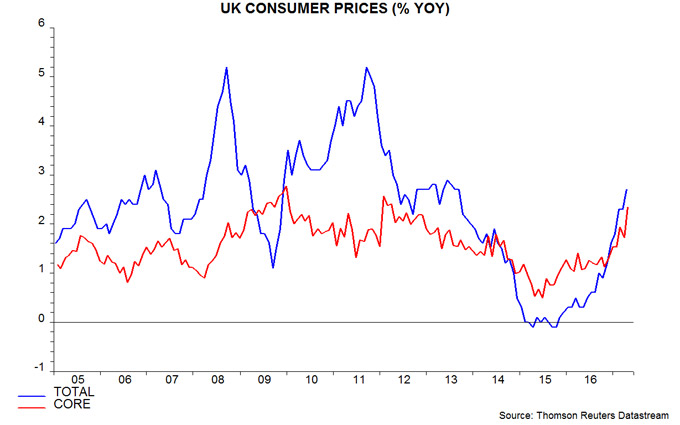
Core prices increased at a seasonally adjusted annualised rate of 2.9% in the three months to April from the previous three months – second chart. (Note that the seasonal adjustment programme used accounts for Easter timing effects.)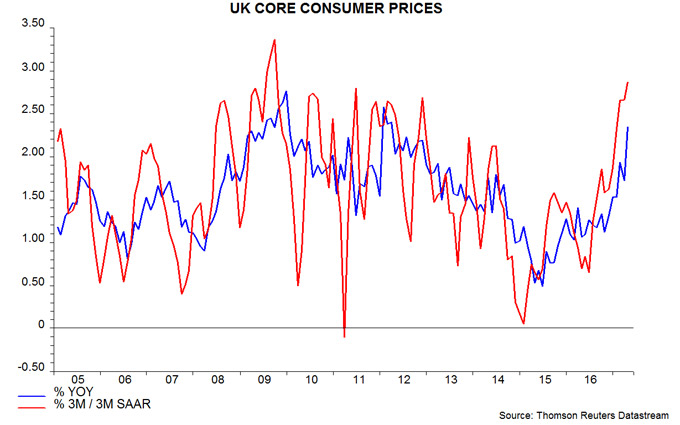
Annual core producer output price inflation – i.e. excluding food, beverages, tobacco and petroleum – also continued to pick up in April, reaching 2.8%, the highest since 2011. Core PPI inflation has often moved ahead of core CPI inflation historically, suggesting a further increase in the latter – third chart.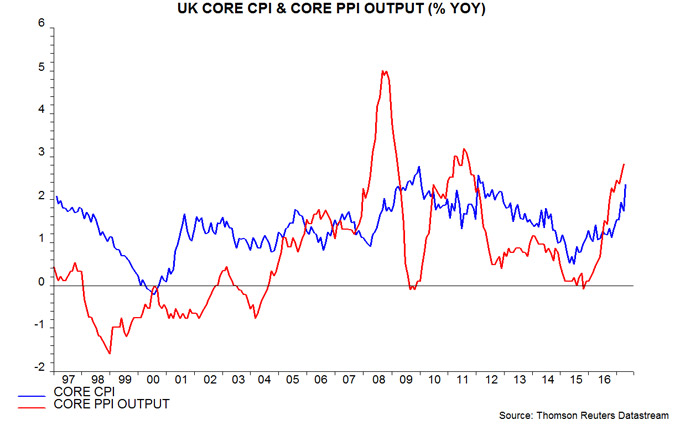 The long-standing forecast here that CPI inflation would move above 3% during 2017 was based on core inflation rising to about 2.5% and upward pressure on energy / food prices lifting the headline / core gap to more than 1 percentage point (pp). Core inflation is on track but the headline / core gap pulled back from 0.6 pp in March to 0.4 pp in April.
Stronger food price inflation should contribute significantly to a widening of the gap over coming months. Annual food inflation remained modest at 1.8% in April but large increases in home-produced and imported food material costs suggest a pick-up to perhaps 5-6% later in 2017 – fourth chart.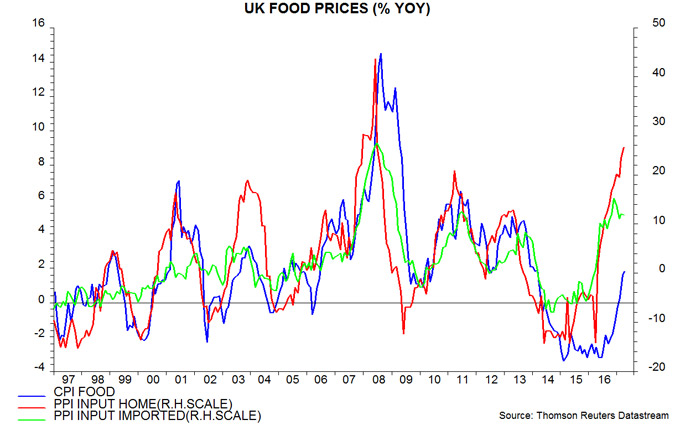
As previously argued, inflation is rising in lagged response to a significant increase in monetary expansion between 2011 and late 2016. The fall in the exchange rate has been part of the “transmission mechanism” from loose money to faster price rises, rather than being a primary driver. The historical evidence is that money growth peaks lead core inflation peaks by between two and three years. Assuming that annual broad money growth topped out last autumn*, the suggestion is that inflation will remain under upward pressure through late 2018, at least.
*Annual growth of non-financial M4 peaked at 6.8% in September 2016 and was 5.2% in March 2017.
Chinese money growth slowing but still respectable
Chinese nominal and real economic growth may be starting to moderate, consistent with a slowdown in monetary expansion since the second half of 2016. Money trends, however, remain respectable by historical standards, suggesting that economic weakness will be contained.
Annual industrial output growth fell back from 7.6% in March to 6.5% in April, while producer price inflation moderated from 7.6% to 6.4%. The product of industrial output and producer prices is a rough guide to nominal GDP, annual growth of which is likely to have peaked in the first quarter of 2017 – see first chart.
A topping out of nominal GDP growth in the first half of 2017 had been suggested by slower monetary expansion in late 2016. Annual growth of the preferred narrow and broad money measures here peaked in August and November 2016 respectively – second chart*.
The money growth measures eased further in April but have retraced less than one-third of their rise over 2015-16. The monetary backdrop, therefore, remains considerably more expansionary than in late 2014 / early 2015.
The third chart shows six-month growth rates of industrial output, real narrow money and real total social financing (real = deflated by consumer prices). Real narrow money growth has fallen significantly since August 2016 but remains above its average since 2010. Real financing growth, meanwhile, has only recently edged lower.
Investors are concerned that a recent policy-driven tightening of money market conditions, reflected in significantly higher interest rates, will cause the economy to slow sharply over the summer. This change, however, will take several months to feed through to money growth, which typically leads activity by six to 12 months, suggesting that the negative impact will be delayed until late 2017. The PBoC, moreover, may act to temper the recent squeeze.
Interest rates on bank lending edged up in the first quarter but remained well down from 2014-15, according to just-released PBoC data – fourth chart.
Annual growth of private fixed asset investment in value terms fell to a four-month low in April but weakness is likely to prove temporary, with strong growth of profits and enterprise bank deposits continuing to give a positive signal – fifth chart.
*Narrow money = “true” M1 = official M1 plus household demand / temporary deposits (relevant for assessing consumer spending prospects). Broad money = M2 minus financial sector deposits (volatile and unrelated to economic prospects).
