
Entries from March 5, 2017 - March 11, 2017
UK Q4 GDP strength fading in Q1
 Simon Ward
 Post a Comment
UK data on industrial / construction output and services turnover released today suggest a further upward revision to fourth-quarter GDP growth but a significant slowdown in the current quarter.
The last GDP release on 22 February reported growth of 0.7%, or 0.71% before rounding, between the third and fourth quarters of 2016. This estimate incorporated quarterly increases in industrial and construction output of 0.3% and 0.2% respectively. These numbers were revised up to 0.4% and 1.0% in today’s releases, implying a rise in GDP growth to 0.76%, assuming no other changes. Services output seems unlikely to be revised down, since services turnover – which feeds into the output data – also grew by slightly more than previously estimated in the fourth quarter. The revised GDP release on 31 March, therefore, may report quarterly growth of 0.8%.
January data, however, suggest that current-quarter growth will be significantly lower. Industrial and construction output both fell by 0.4% between December and January, while services activity also seems to have weakened slightly, based on the turnover data. GDP is estimated here to have eased back by 0.2% in January to stand 0.3% above the fourth-quarter level. Assuming a resumption of moderate growth in February / March, this suggests a first-quarter GDP increase of 0.4-0.5%. Note that another batch of monthly data will appear before the Office for National Statistics releases its preliminary first-quarter estimate on 28 April.
Is the US jobless rate bottoming?
The US unemployment rate fell to 4.7% in February but remains above a low of 4.6% reached in November 2016. The judgement here is that it may stabilise or edge higher, for three reasons.
First, the jobless rate is inversely correlated with the job openings or vacancies rate, which has retreated from a peak in April 2016 – see first chart. Companies are reluctant to lay off workers – reflected in a low level of weekly initial unemployment claims – but the decline in the openings rate suggests that they are not stepping up recruitment. This may partly reflect uncertainty about healthcare and tax reforms.
Secondly, the labour force participation rate – the percentage of the civilian population in or seeking work – has stopped falling. It may even be embarking on a modest upward trend – second chart. The combination of population growth and a rising participation rate may allow moderate employment expansion to be maintained without a further reduction in unemployment.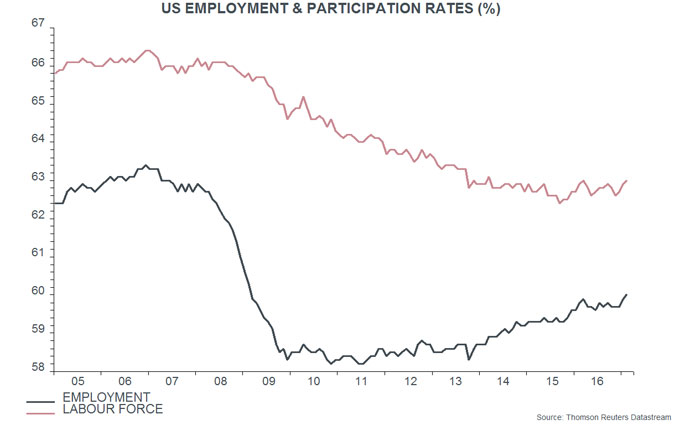
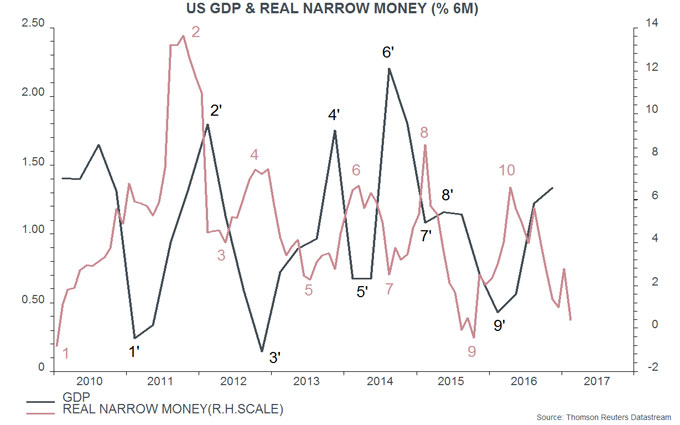
Thirdly, growth of labour demand is coincident with or lags GDP expansion – third chart. As previously discussed, real narrow money trends suggest a GDP slowdown into the summer – fourth chart. Recent elevated unit labour cost growth adds to the risk that companies will curb recruitment if economic expansion moderates.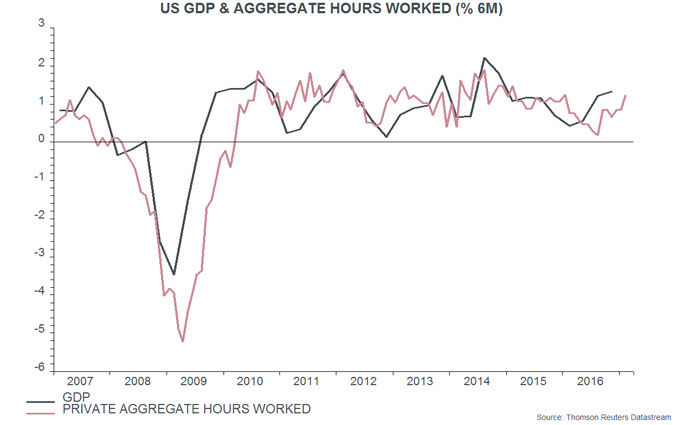
Global leading indicator supporting monetary slowdown signal
The OECD’s leading indicators are giving tentative confirmation of the forecast here, based on real narrow money trends, that global economic momentum will peak in spring 2017 and slow into the autumn.
The OECD this week released January data for its country leading indicators. Note that the January estimates of the trends in the components incorporate February data where available – so the indicators already reflect strong February business survey results, for example. The country information is combined and transformed here to create a global (i.e. G7 plus E7) leading indicator of industrial output. Six-month growth of this indicator continued to rise in January but the one-month increase fell back – see first chart.
As previously discussed, global six-month real narrow money growth peaked in August 2016, suggesting a peak in industrial output expansion around May 2017, allowing for an average nine-month lead. Six-month growth of the leading indicator may have peaked in January, based on the fall in one-month momentum. It typically leads by four to five months, so this would suggest a peak in economic momentum in May-June, consistent with the monetary signal.
The prospect of a summer economic slowdown, coupled with the Fed’s recent hawkish shift, may imply stronger headwinds for equity markets and other risk assets. Any setback, however, could prove to be modest and temporary if investors believe that the economy will retain reasonable momentum and / or reaccelerate in late 2017.
Such a scenario cannot be ruled out based on current monetary data. Global six-month real narrow money growth, while well down from last summer, remains at a respectable level by historical standards, after adjusting for an excessively negative signal from Indian M1 due to the demonetisation programme – second chart. The recent fall has partly reflected a sharp rise in six-month consumer price inflation, which is likely to moderate if commodity prices stabilise at their current level. In the US, February narrow money numbers may have been depressed by a delayed send-out of income tax refunds, reflecting legal changes: refunds last month were $25 billion lower than in February 2016, equivalent to 0.9% of the narrow money stock measure tracked here – third chart.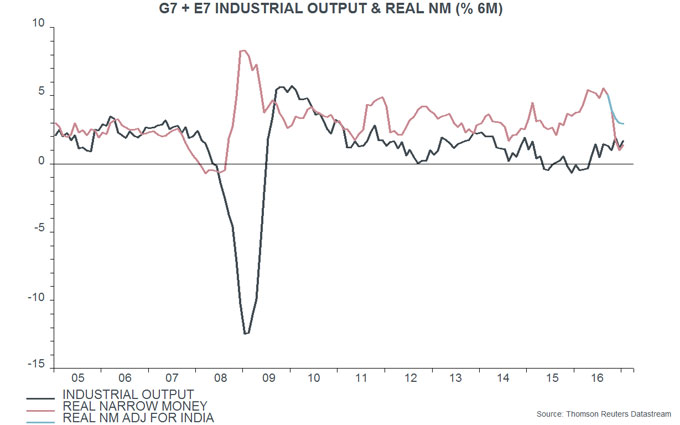

UK Budget: safety-first now, autumn fireworks possible
Chancellor Hammond was constrained by Office for Budget Responsibility (OBR) forecasts showing little carry-over of this year’s borrowing undershoot into future years. With no “back of the sofa” money to spend, Mr Hammond opted to raise taxes to plug the funding gap for social care and pay for additional business rates relief and higher spending on education / training. He did so by hiking national insurance contributions for the self-employed and – unexpectedly – slashing the recently-introduced dividend allowance.
The net effect of all government decisions – including the boost to spending from the recent cut in the personal injury discount rate – is to raise borrowing by £3.1 billion in 2017-18, with the amount falling in the subsequent two years and turning into a reduction of £1.0 billion in 2020-21. These numbers are rounding errors – £3.1 billion is equivalent to 0.15% of forecast nominal GDP in 2017-18.
Mr Hammond’s caution may partly reflect a desire to delay major initiatives until the new Autumn Budget. He may have greater room for manoeuvre by then, since borrowing may continue to undershoot the OBR’s forecast. A key assumption is that nominal GDP growth will fall from an estimated 4.2% in 2016-17 to 3.3% in 2017-18, contributing to a slower increase in tax receipts. However, nominal GDP rose by an annual 4.9% in the fourth quarter of 2016 and monetary trends suggest continued solid expansion in 2017 – see chart.
The new OBR numbers show an odd-looking profile for cyclically-adjusted net borrowing, which now rises from 2.6% of GDP in 2016-17 to 2.9% of GDP in 2017-18 before dropping sharply to 1.9% in 2018-19. The suggestion is that fiscal policy will be expansionary this year but will turn significantly contractionary next year, when the Brexit uncertainty drag on growth may reach a peak. This profile looks implausible: solid nominal GDP growth may result in stronger tax receipts and lower borrowing in 2017-18, while the Chancellor may choose to deliver a significant fiscal stimulus this autumn to cushion the Brexit effect.
