Entries from February 26, 2017 - March 4, 2017
US ISM consistent with spring global growth peak
 Simon Ward
 Post a Comment
The US Institute for Supply Management (ISM) manufacturing new orders index – widely followed as an indicator of US / global industrial activity – reached its equal highest level since 2009 in February. This is consistent with the suggestion from global narrow money trends that economic momentum will rise to a peak in spring 2017 before slowing into the second half of the year. The ISM orders index is expected here to fall back over coming months.
Narrow money trends provide a significantly longer lead on future economic activity than the ISM survey. The first chart shows the ISM new orders index and six-month global real narrow money growth pushed forward six months. The strong February ISM reading matches a peak in real money growth in August 2016. Based on this relationship, the ISM orders index may have reached a peak in February and is likely to decline into mid-year.
Three other considerations suggest that ISM strength will fade. First, the February orders surge partly reflected increased inventory building, which is likely to prove temporary. The ISM inventories index rose to its highest level since 2015 last month.
Secondly, consumer spending on goods has slowed, suggesting insufficient final demand to maintain the current pace of orders expansion. Three-month growth of retail sales volume fell to 0.6%, or 2.5% annualised, in January – second chart – while February auto sales were lacklustre. Demand for capital goods is recovering but probably not enough to offset this softness.
Thirdly, ISM strength has not been confirmed by East Asian business surveys, which usually act as a bellwether of global trends. The Federation of Korean Industries February survey, indeed, reported a marked weakening of business expectations, although this may be partly attributable to political and corporate scandals – third chart.
The pattern of recent years has been that periodic slowdowns in the global economy have swiftly led to additional monetary policy stimulus, limiting and eventually reversing any damage to equities and other risk assets. Major central banks, however, may take a tougher line this year, reflecting low unemployment rates, high headline and rising core inflation, and a growing “populist” backlash against low / negative rates and neverending QE.
UK money trends suggesting "stagflation"
UK monetary trends correctly predicted recent economic strength but are now signalling a second-half slowdown. The earlier buoyancy, however, is likely to sustain upward pressure on inflation into 2018, suggesting a difficult “stagflationary” backdrop for the MPC and markets.
The big story in last week’s fourth-quarter GDP report was not the expected upward revision in quarterly output growth from 0.6% to 0.7% but rather a sharp increase in nominal GDP expansion – annual growth rose to 4.9%, the fastest since 2014 and up from just 2.1% a year earlier. This strength has been driven by an acceleration in the GDP deflator, which rose by 2.8% in the year to the fourth quarter, the largest annual gain since 2008 – see first chart. This ought to be ringing alarm bells at the Bank of England, since the GDP deflator is a broad measure of domestically-generated inflation and is not directly affected by changes in import costs.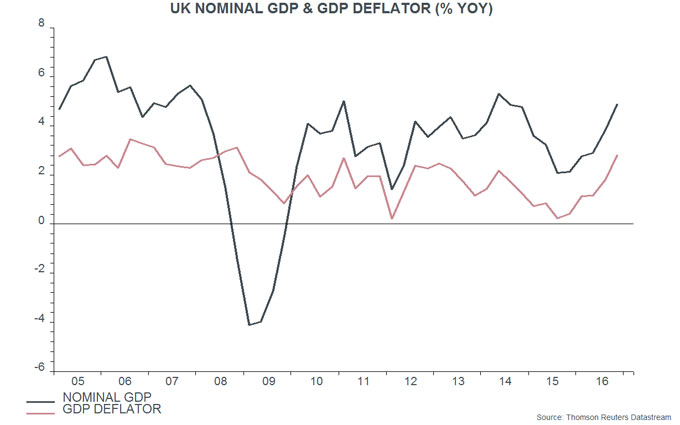
Nominal GDP numbers, admittedly, are often revised significantly but the suggested strength is consistent with recent higher-than-forecast tax receipts and undershooting public sector borrowing.
Faster nominal GDP expansion was predicted by an acceleration of narrow and broad money – measured by non-financial M1 and non-financial M4 – in 2015-16. Annual growth of the two measures has moderated since September 2016 but remains solid by post-crisis standards, at 9.2% and 5.5% respectively in January – second chart. Allowing for the usual six to 12 month lead, this suggests that nominal GDP growth will rise further in the first half of 2017 and remain elevated into year-end, and probably beyond.
The question, then, is how nominal GDP growth will divide between output expansion and inflation. The preferred monetary measure here for forecasting fluctuations in economic activity is the six-month rate of change of real (i.e. consumer-price-deflated) narrow money. This measure peaked in June 2016 and has fallen sharply since October, to its lowest since 2012, reflecting a pick-up in six-month CPI inflation as well as lower nominal money expansion – third chart. This slowdown suggests that two-quarter output momentum is at or close to a peak and will decline during the second half of 2017. Real narrow money, however, is not yet signalling outright economic weakness – the six-month change is still far from turning negative, as it did before the 2011-12 “double dip” scare.
Household and corporate (PNFC) narrow money trends are informative about prospects for consumer spending and business investment respectively. Six-month growth rates of real household and PNFC M1 were similar in January – fourth chart. Both have moderated recently but have yet to signal significant spending weakness.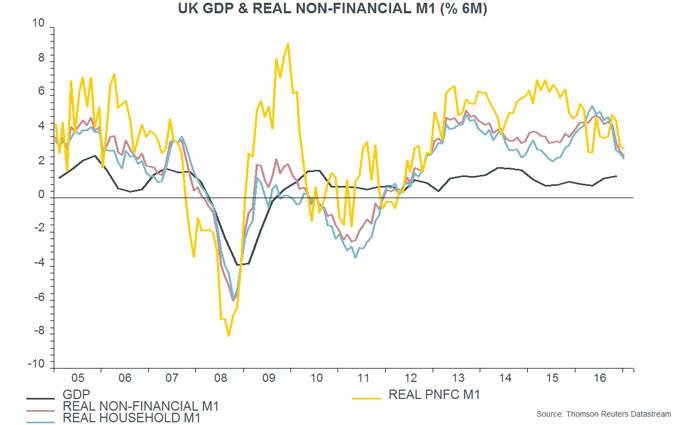
The suggestion that nominal GDP expansion will remain firm while output growth will moderate implies further upward pressure on GDP deflator inflation. Such strength would undermine the MPC’s claim that rising CPI inflation is entirely explicable by sterling weakness and commodity price gains, with no impact from domestic capacity pressures or “second-round” effects.
How would the MPC respond? The market judges that the Committee will have a strong aversion to raising rates during the Brexit negotiation process, almost irrespective of inflation or currency developments. Even Governor Carney, however, may believe that policy credibility has been stretched to its limit; he may, in any case, be running out of new excuses to defend the MPC’s ultra-loose stance.
Eurozone money trends suggesting stable growth, rising inflation
Eurozone economic news remains solid – the Markit composite PMI output index, for example, reached its highest level since 2011 in February, moving above the corresponding US index. Robust economic performance was predicted by monetary trends last year (e.g. here). Nominal money growth remains strong but rising inflation has moderated real expansion. Current trends suggest that economic growth will continue at a respectable pace while “core” inflation will follow headline inflation higher later in 2017.
The preferred narrow and broad monetary aggregates here are non-financial M1 and M3, comprising money held by households and non-financial corporations – the headline M1 / M3 measures additionally include financial corporations’ holdings but these contain little information about near-term economic prospects. Annual growth of non-financial M1 rose to 9.7% in January, a nine-month high, while growth of non-financial M3 reached 5.9%, the highest since 2008. The recent increases suggest that annual growth of nominal GDP will pick up during 2017 – see first chart.
The preferred monetary measure here for forecasting fluctuations in economic activity is the six-month rate of change of real (i.e. consumer-price-deflated) non-financial M1. This has moderated since the first half of 2016 but remains solid by historical standards and was little changed in January – second chart. The slowdown in recent months has been entirely due to rising inflation, with six-month nominal growth moving higher – third chart.
Six-month real non-financial M1 growth is around the middle of its range over the past three years, a period during which GDP expansion has averaged 1.7% per annum – a reasonable expectation for the pace of growth over the next two to three quarters. Such growth would be above “potential” economic expansion estimated by the EU Commission, IMF and OECD at 1.0-1.2% in 2017, implying a further fall in unemployment.
Rising nominal money growth, meanwhile, suggests that stable real economic expansion will be accompanied by higher inflation, as measured by the GDP deflator – the broadest measure of domestic prices. Faster growth in the GDP deflator would be expected to be associated with a rise in “core” consumer price inflation (i.e. excluding energy, food, alcohol and tobacco) – fourth chart.
A recent post noted that the euro exchange rate was depressed in 2016 by a record outflow of direct and portfolio investment – this outflow swamped a rising current account surplus, resulting in a large “basic balance” deficit. The post suggested that the outflow would slow in 2017, partly reflecting QE “tapering”, supporting the euro. This slowdown may have begun, judging from data on the net external asset position of monetary financial institutions (MFIs): the change in such assets mirrors the basic balance and the decline in the six months to January was the smallest for a year – fifth chart.