Entries from February 5, 2017 - February 11, 2017
UK growth strong at end-2016, money trends cautionary
UK December data for industrial / construction output and services turnover suggest that fourth-quarter GDP growth will be revised up to 0.7%. Investors should be wary of extrapolating current economic strength, since monetary trends have weakened recently.
The Office for National Statistics (ONS) today reported that industrial and construction output rose by 1.1% and 1.8% respectively between November and December – above estimated gains of 0.6% and 1.0% incorporated in its preliminary estimate that GDP grew by 0.6% last quarter. More importantly, the services turnover survey – also released today but ignored by most economists – suggests that output in that sector increased further in December despite a previously-reported 1.9% drop in retail sales / output; the ONS had assumed that services output would be stable at November’s level. If so, fourth-quarter GDP growth is likely to be raised to 0.7% – revised figures will be released on 22 February. Growth excluding the oil and gas sector could rise to 0.8% (0.7% currently).
The February Inflation Report projected that GDP growth would be unrevised at 0.6% in the fourth quarter and fall to 0.5% in the first quarter. Based on current evidence, the level of GDP in December may have been 0.3-0.4% above the fourth-quarter average, suggesting upside risk to the Bank’s first-quarter growth forecast.
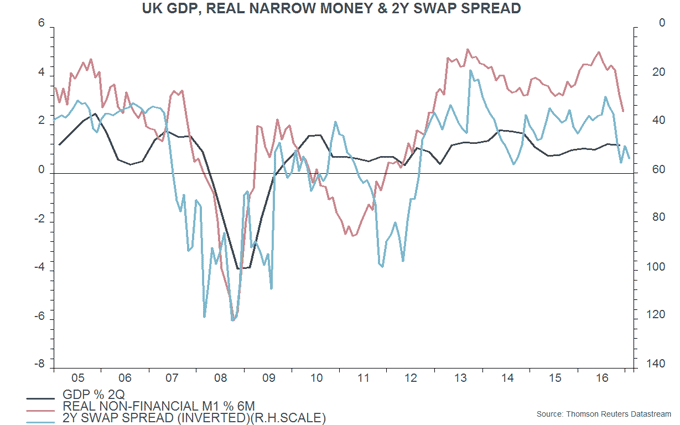
An upward revision in fourth-quarter growth to 0.7% would imply that GDP rose by 1.3%, or 2.6% annualised, in the third and fourth quarters combined – the largest two-quarter gain since the fourth quarter of 2014. A pick-up into early 2017 had been predicted by a rise in six-month real narrow money expansion to a peak in June 2016 – see chart. It is likely that second-half GDP growth would have been significantly stronger but for the Brexit vote – see previous post.
Real narrow money growth remained solid through October but weakened in November / December, suggesting that the economy will retain momentum through the first half of 2017 but slow in the summer. A cautionary signal is also being given by a recent widening of the two-year swap spread, which – as in the US – has been inversely correlated with future economic growth in recent years.
Global leading indicator strong but momentum possibly peaking
The OECD’s country leading indicators are giving an upbeat message for the global economy in early 2017, in line with an earlier positive signal from monetary trends. The indicators have yet to confirm the suggestion from the latest monetary data that global economic momentum will fade towards mid-year.
The OECD yesterday released December data for its country leading indicators, allowing an update of the global (i.e. G7 plus emerging E7) leading indicator calculated here. Six-month growth of this indicator continued to rise in December. Allowing for an average lead time at historical turning points of four to five months, this suggests that six-month growth of industrial output will remain on an upward trend through April / May – see first chart.
As previously discussed, global real narrow money trends suggest that six-month industrial output growth will peak around May and move lower over the summer. Such a scenario would be consistent with six-month leading indicator growth peaking in December or January. The current monetary and leading indicator signals, therefore, are compatible.
While six-month leading indicator growth rose further in December, a levelling-off of the one-month increase hints that the six-month measure is approaching a top – first chart.
The OECD country details showed broad-based strength. The Chinese leading indicator, in particular, remains upbeat, with both six- and one-month growth rising further in December – second chart.
US swap spread echoing cautionary monetary signal
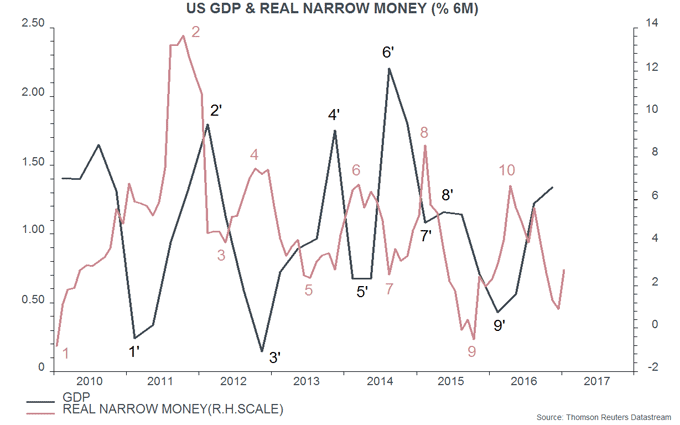
US narrow money trends suggest a moderation of economic growth in the spring / summer – see post from last week. The two-year swap spread has also led economic fluctuations historically and is giving a similar cautionary message.
The swap spread is a component of the Conference Board’s leading credit index, which feeds into its leading economic index. The spread measures the cost of bank funding over and above the level of “safe” market rates. A rise in the spread indicates that the supply of funding has fallen relative to demand, and may be associated with a reduction in credit supply and higher bank lending / deposit rates.
Narrow money is viewed here as being demand-determined and influenced importantly by spending intentions, explaining why it leads the economy. A reduction in credit supply / higher bank interest rates discourage spending, which may partly account for an observed inverse correlation between narrow money trends and the swap spread.
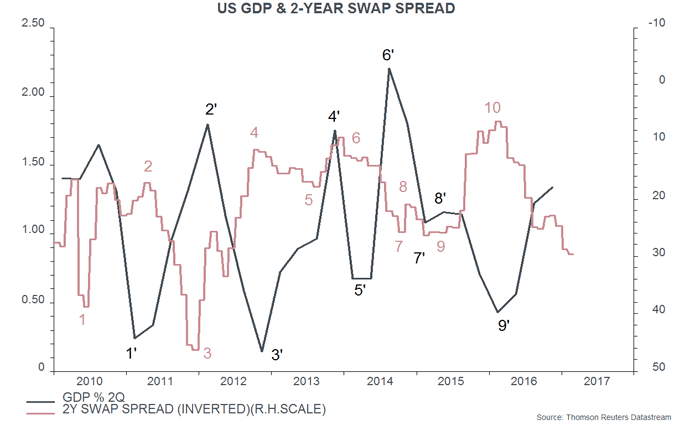
The first chart, reproduced from the earlier post, shows that turning points in six-month real narrow money growth have consistently led those in two-quarter GDP growth in recent years. The second chart shows a similar relationship with the inverted swap spread.


The spread, while still low by historical standards, has widened steadily since early 2016, reaching its highest level since 2012. Why?
One explanation is last year’s reform of money market fund regulations, which resulted in a large movement out of “prime” funds able to invest in a wide range of assets – including bank liabilities – into those limited to government securities. This reduced the supply of bank funding and probably explains a 9% fall in large time deposits at commercial banks during 2016.
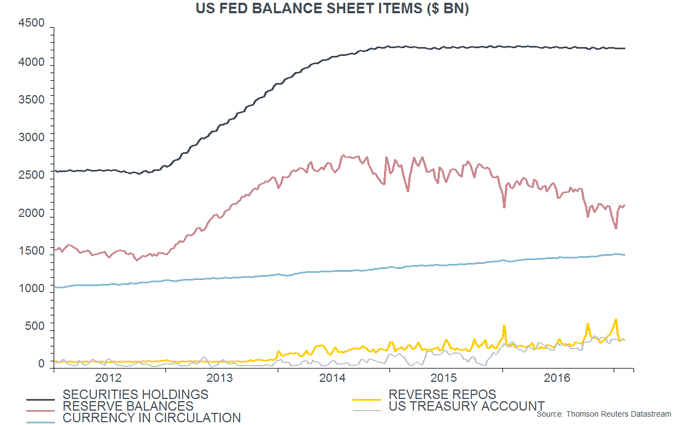
The second explanation is that the Federal Reserve has allowed the stock of bank reserves to contract significantly since late 2015, reducing the pool of “excess” reserves available for lending in the funding market. Reserve balances averaged $2.093 trillion in January, down from $2.668 trillion in October 2015 – a 22% drop over 15 months.
The fall in reserves does not reflect any reversal of QE: in line with its stated policy, the Fed has been reinvesting principal repayments and its securities portfolio has remained stable – third chart.

The fall in reserves, instead, has been mainly due to three changes on the liabilities side of the Fed’s balance sheet:
-
“Normal” growth of currency in circulation: banks obtain additional currency for their customers by exchanging reserves with the Fed.
-
A rise in the US Treasury’s deposit balance at the Fed: a higher balance reduces bank reserves, unless offset by Fed market operations.
-
Growth of the Fed’s overnight reverse repo program following a lifting of the $300 billion aggregate cap in December 2015.
The reserves fall, therefore, can be argued to have occurred “naturally” rather than being the result of deliberate Fed policy. The Fed, however, has chosen not to offset the decline despite upward pressure on bank funding costs from the money market fund reform.
Global money trends cooling
Global six-month real narrow money growth fell further in December, suggesting that the world economy will lose momentum during the second half of 2017.
The global narrow money measure tracked here – covering the G7 economies and seven large emerging economies (the “E7”) – has been distorted by India’s “demonetisation” programme, which resulted in a 28% fall in M1 between end-October and end-December, with a recovery now under way. This policy has delivered a short-term shock to the Indian economy but the global implications are limited. An attempt, therefore, has been made to adjust for the distortion by recalculating the global money measure keeping Indian M1 stable at its October level.
Six-month growth of this adjusted measure, deflated by consumer prices, peaked in August 2016 and fell further in December to its lowest level since October 2015. Allowing for an average nine-month lead at turning points, this suggests that global industrial output growth will peak around May and decline through September – see first chart.

The forecasting approach here seeks confirmation of monetary signals from a global leading indicator based on the OECD’s country leading indicators. Six-month growth of this indicator was still rising in November, the latest available month – first chart. The average lead time at historical turning points has been four to five months, so a peak in December or January would be consistent with a May peak in output growth. The OECD will release December data for its indicators tomorrow.
The slowdown in the adjusted global real narrow money measure has been driven by the G7 component and the US in particular – see previous post. Chinese monetary trends remained strong through end-2016, sustaining E7 real money growth, adjusted for the India effect, above the G7 level – second chart. With the PBoC starting to tighten policy – as suggested in a post in December – Chinese narrow money growth may cool but the E7 aggregate may be supported by a reversal of weakness in Brazil / Russia in response to falling inflation / interest rates.


