Entries from January 15, 2017 - January 21, 2017
Chinese GDP inflation surge arguing for tighter policy
Chinese nominal GDP growth strengthened significantly in late 2016 and monetary trends suggest a further pick-up through the first half of 2017, at least. Concern about rising inflation is expected here to be reflected in gradual monetary policy tightening that may boost the renminbi in the absence of US protectionist actions.
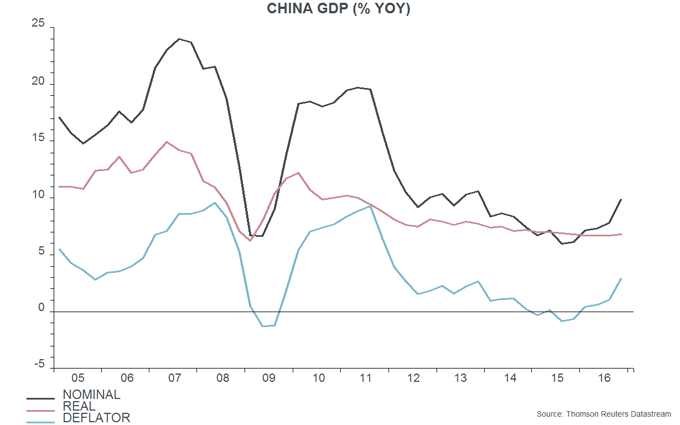
Annual growth of nominal GDP has risen from a low of 6.0% in the third quarter of 2015 to 9.9% in the fourth quarter of 2016, a three-year high. The increase has been driven by the GDP deflator, with annual growth of real GDP stable at 6.7-6.9% over this period, according to National Bureau of Statistics (NBS) data – see first chart.
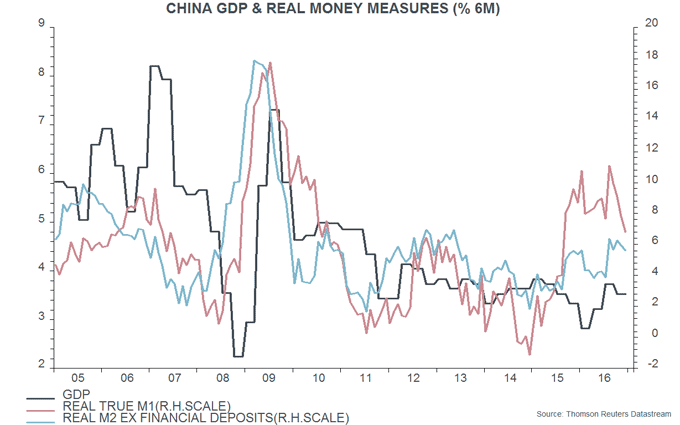
The stability of annual real GDP growth, however, conceals a significant economic slowdown in 2015 / early 2016 followed by a marked recovery. Two-quarter real GDP expansion* fell to a low of 2.8% in the first quarter of 2016 (equivalent to annualised growth of 5.7%) but rebounded to 3.7% (7.6% annualised) in the third quarter, remaining strong at 3.5% (7.2%) in the fourth quarter. This slowdown and recovery were foreshadowed by weakness in inflation-adjusted money measures in 2014 that reversed in 2015-16 – second chart.
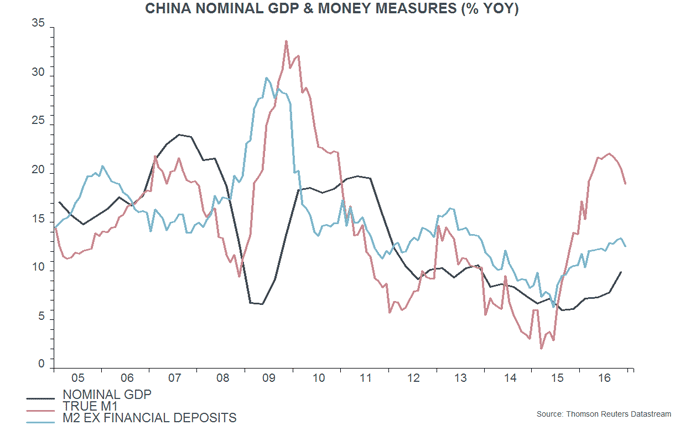
Annual growth rates of narrow and broad money may have peaked out in late 2016 but usually lead nominal GDP growth by six to 12 months, suggesting that the latter will rise further into the second quarter of 2017, at least – third chart. GDP inflation is likely to continue to drive the pick-up, although economic growth will probably also firm.
Consumer price inflation was 2.1% in December but may narrow the gap with rising GDP deflator inflation – 2.9% in the fourth quarter, the highest since the first quarter of 2012 – as the year progresses. The authorities will want to avoid an overshoot of the 3% target and may continue to tighten monetary policy to head off this prospect. Tighter monetary conditions may be associated with a slowdown or reversal of capital outflows and a consequent stabilisation or recovery in the renminbi – see previous post.
*Derived from NBS quarter-on-quarter seasonally-adjusted growth data.
UK inflation: above-consensus forecast on track
A post in October suggested that UK annual consumer price inflation would move above 3% by mid-2017. Such a scenario remains plausible.
CPI inflation rose from 1.2% in November to 1.6% in December. The increase was exaggerated by a statistical quirk related to air fares that should unwind in January. The December rate would have been 1.5% in the absence of this effect*.
“Core” inflation – excluding energy, food, alcohol and tobacco – has risen from a low of 0.8% in June 2015 to 1.6% in December, or 1.5% excluding the air fares quirk. Core inflation is expected here to reach around 2% by mid-2017. The proximate cause is pass-through of higher prices of imported goods due to sterling weakness – manufactured import prices rose by an annual 11% in the year to November. The CPI core goods index has yet to reflect this surge, increasing an annual 0.3% in December.
The deeper driver is a loosening of monetary conditions from 2011: annual growth of broad money** has risen from below 2% then to 6-7% recently, and swings in monetary growth have consistently led major core inflation swings since World War Two, typically by two to three years – see first chart*** and previous post. This relationship implies that core inflation will remain under upward pressure later in 2017 and in 2018.
The forecast of 3%+ CPI inflation by the summer also incorporates a significant boost from surging commodity prices. The S&P GSCI commodity price index in sterling terms is currently 60% above its year-ago level, and similar rates of increase historically have resulted in a wedge of at least 1 percentage point opening up between headline and core inflation – second chart. 
Food as well as energy prices should be boosting headline CPI inflation by the summer, with strong pipeline pressure evident in producer food input prices – third chart.
*Air fares are seasonally strong in December and rose by 49% last month versus 46% in December 2015. Their weight in the index increased from 6 to 8 parts per thousand between December 2015 and December 2016. The weighting increase boosted the monthly impact on the CPI by 10 basis points last month relative to December 2015 (i.e. 46% times 0.002). Air fares usually reverse December strength in January so the effect should unwind this month.
**Non-financial M4.
***The chart uses core RPI rather than CPI inflation because of its much longer history.

