Entries from December 11, 2016 - December 17, 2016
Global economy strong but money trends cooling
 Simon Ward
 Post a Comment
Incoming news is consistent with the forecast here of a global economic “boomlet” in early 2017. Economic acceleration reflects a loosening of monetary conditions in early / mid 2016 but global real narrow money is now slowing, suggesting a loss of momentum in mid 2017. The combination of falling real money growth and rising economic growth may indicate reduced liquidity support for equity markets.
Global business survey results released this week have been strong. In the US, an average of the new orders components of the New York and Philadelphia Fed manufacturing surveys rose to the top of its historical range, suggesting that the new orders index of the national Institute for Supply Management (ISM) survey will move above 60 – see first chart.
In the Eurozone, the new orders index of the manufacturing purchasing managers’ survey rose to a 68-month high. The corresponding Japanese index also strengthened significantly and has yet to incorporate the full effect of recent yen weakness. In the UK, CBI manufacturing output expectations remained buoyant despite a modest recovery in sterling.
Emerging global economic strength was predicted by a surge in six-month growth of G7 plus E7 real narrow money to a peak in August 2016. This peak suggests that economic momentum will top out in spring 2017, allowing for an average nine-month lead. Incoming monetary data, meanwhile, hint at a significant subsequent slowdown.
A November estimate of the G7 plus E7 narrow money aggregate tracked here is now available but has been heavily distorted by India’s “demonetisation” programme, which has resulted in a 23% fall in the M1 money stock, partly reflecting a temporary shortage of replacement bank notes. This decline is very negative for Indian near-term economic prospects but the global implications are probably limited. Even assuming that Indian M1 had remained at its October level, however, six-month growth of G7 plus E7 real narrow money would have fallen further in November, based on available data* – second chart.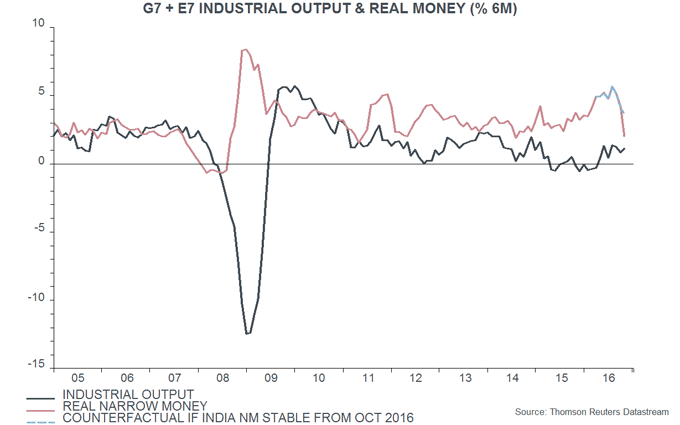
A slowdown in US real narrow money has been a key driver of the recent global decline: US six-month real money growth is at its lowest level since February, with a reduction in nominal expansion mainly responsible, rather than a pick-up in inflation. Japanese real money has also slowed sharply, while Chinese growth has moderated, though remains strong – third chart.
The formal equities versus cash switching rules described in a previous post recommend moving into cash if 1) G7 annual real narrow money growth falls beneath industrial output growth, 2) real money growth falls beneath 3% or 3) real money growth falls by 3 percentage points within six months. None of these conditions has yet been met. The real money / output growth gap, however, is narrowing, suggesting that the portion of money growth destined to flow into securities is diminishing. Markets, in other words, may have less liquidity “insulation” from negative shocks.
*November estimate based on c.70% data coverage; annual money growth assumed stable for missing countries.
Is the Fed misreading the economy (again)?
The Federal Reserve delivered the expected quarter-point rise to 0.625% in the federal funds rate* and signalled a modest hawkish shift in its policy intentions, with the median assessment of the 17 meeting participants of the appropriate funds rate at end-2017 rising from 1.125% in September to 1.375%. The median forecast overstates the collective change of view – the mean assessment rose by only 6 basis points (bp), i.e. from 1.31% to 1.37%. The shift reflects recent mostly-solid economic data – in particular, a further fall in the unemployment rate to 4.6% – and an increased probability of fiscal stimulus. A cynic might suggest, in addition, that some Committee members previously suppressed more hawkish intentions in an effort to support the status quo candidate in the presidential election.
The Fed’s policy guidance often proves unreliable, particularly when it conflicts with monetary trends. The median forecast in December 2015 was for a 100 bp rise in rates during 2016, despite real narrow money slowing sharply into late 2015, signalling that economic growth was likely to disappoint. It did, and the Fed was forced to backtrack.
Narrow money rebounded strongly in early 2016 but is now slowing again, though less dramatically than in 2015. Six-month growth of real narrow money peaked in August 2016 and is likely to have fallen further in November – data will be released later today. Allowing for an average nine-month lead, the suggestion is that the economy will remain solid through spring 2017, possibly supporting two quarter-point Fed hikes during the first half, but will lose momentum in the summer.
A hawkish counterargument is that fiscal stimulus will sustain robust economic growth later in 2017 and in 2018. The view here, however, is that the effects of fiscal policy are incorporated in narrow money trends: shifts in money demand are largely driven by changes in spending intentions of households and firms, which would strengthen in response to an effective fiscal stimulus. Narrow money growth, in other words, would need to rise in early 2017 to support the hawkish view. Even if it does, the recent slowdown suggests a “soft patch” for the economy next summer.
The path to higher rates is unlikely to be smooth and the risks to the Fed’s guidance for the level of rates at end-2017 are judged here to be weighted modestly to the downside, based on current monetary trends.
*Mid-point of target range.
Will the RMB recover in 2017?
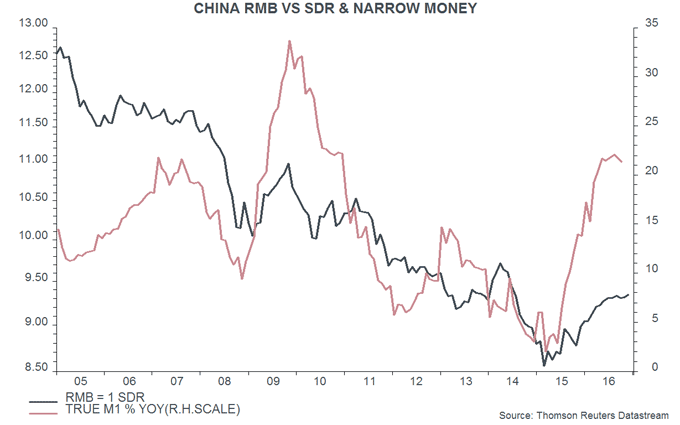
China bears have been arguing for more than a year that capital outflows would tighten domestic monetary conditions, leading to economic weakness and deflation. The “monetarist” view has been that the bears have had the causation the wrong way round: loose policy since early 2015 has resulted in strong monetary growth, part of which has been exported, putting downward pressure on the currency. Capital outflows, in other words, have been a symptom of monetary laxity, not a cause of tightening.
The differing interpretations colour exchange rate forecasts for 2017. The bears argue that the capital exodus is related to overvaluation and financial system risks, and will continue. The monetarist view, by contrast, is that mounting inflationary pressures will force the authorities to tighten policy in early 2017, resulting in slower monetary growth and a corresponding reduction in outflows. With the current account remaining in healthy surplus (2.5% of GDP in the third quarter of 2016), this view suggests a resumption of upward pressure on the currency – unless the new US administration starts a trade war.
Domestic economic developments have largely followed the monetarist script during 2016. Policy loosening in early 2015 was reflected in a rise in monetary expansion between mid-2015 and mid-2016, with narrow money, in particular, surging. The monetary pick-up was followed by a strong acceleration of house prices from late 2015, a rebound in industrial profits from early 2016 and a return to producer price inflation more recently – see first chart.
Economic growth has also revived, although by less than was expected here, possibly due to a structural shift away from heavy industry, which may have reduced potential expansion. GDP growth, nevertheless, rebounded from an annualised 5.7% in the fourth quarter of 2015 / first quarter of 2016 to 7.6% in the second / third quarters, according to the National Bureau of Statistics (NBS). Business surveys, meanwhile, signal a much-improved climate: an average of NBS and Markit purchasing managers' indices covering manufacturing and non-manufacturing / services reached its highest level since 2013 in November.
Policy, however, is turning less expansionary in response to rising inflationary pressures. The authorities have introduced measures since October to take the froth off the housing market and could raise official interest rates in early 2017 as producer / consumer prices continue to accelerate – producer prices climbed 3.3% in the year to November, the largest annual gain since 2011. Recent firmer market rates may be early evidence of a policy shift, with the authorities choosing not to sterilise fully the impact of foreign exchange intervention and year-end demand for liquidity – in contrast to their approach earlier in 2016.
The weakening trend of the renminbi measured against the special drawing right (SDR) basket started as money growth picked up following policy loosening in early 2015 – second chart. Tighter policy and a monetary slowdown could be associated with upward pressure on the currency in 2017.