Entries from October 30, 2016 - November 5, 2016
Global acceleration watch: monetary trends
 Simon Ward
 Post a Comment
Global monetary growth remained strong in September, suggesting that the current upswing in economic momentum will be sustained through mid-2017 (at least), based on the historical average nine-month lead from money to output.
Annual growth of narrow money in the G7 major economies and seven large emerging economies (the “E7”) rose to 11.7% in September, the fastest since 2009 (slightly exceeding a 2011 peak of 11.6%). Broad money growth firmed to 7.5%, the fastest since 2013 – see first chart.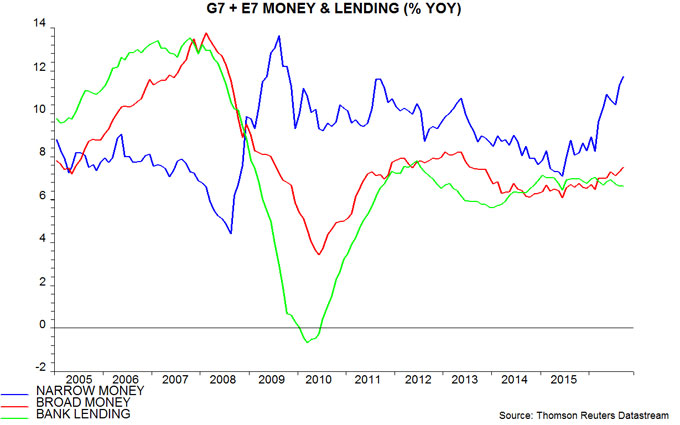
The forecasting approach here emphasises the six-month growth rate of real (i.e. consumer price-adjusted) narrow money. This edged down in September from August’s seven-year high, reflecting both a decline in nominal expansion and higher inflation. There was a similar downtick in six-month real broad money growth – second chart.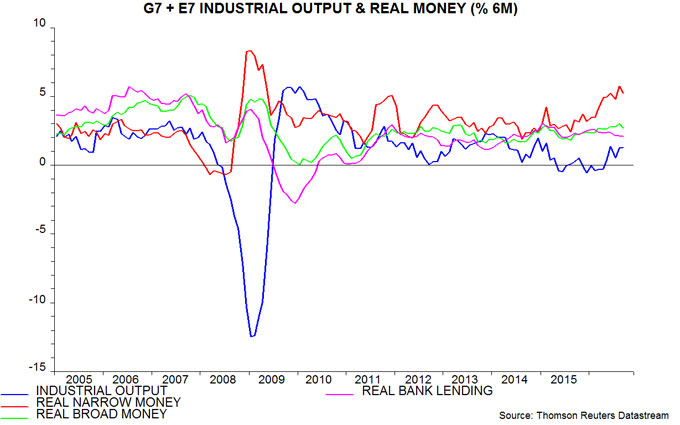
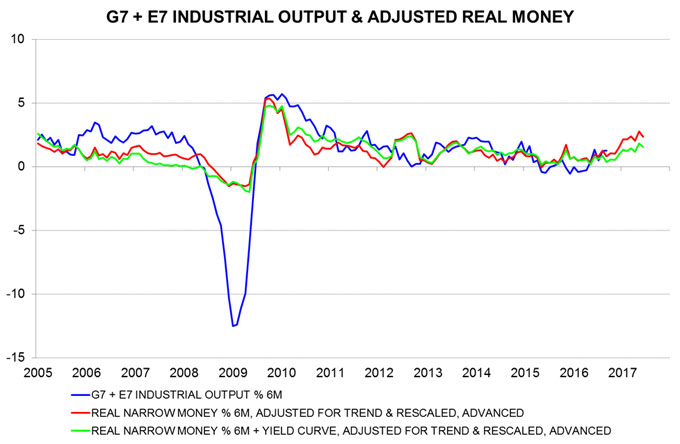
The third and fourth charts show adjusted real narrow money growth measures. The red line applies the historical average nine-month lead from real money to output and also adjusts for a long-run downward trend in the rate of change of narrow money velocity. The green line additionally incorporates the slope of the G7 government yield curve, which has also performed impressively as a leading indicator historically (but may be less reliable now because of central bank manipulation of bond markets). As the fourth chart shows, current G7 plus E7 industrial output growth is broadly in line with the “forecasts”, which are signalling a further pick-up in momentum through spring 2017.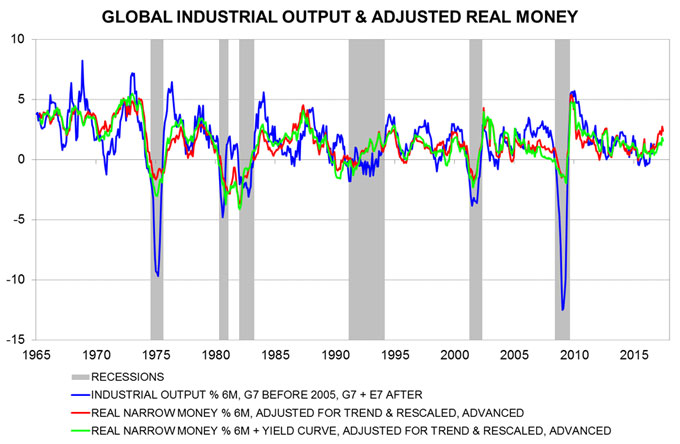
The small decline in G7 plus E7 six-month real narrow money growth in September reflected a fall in the G7 component, which is nonetheless much stronger than a year ago. E7 real money growth, by contrast, rose to a new six-year high – fifth chart.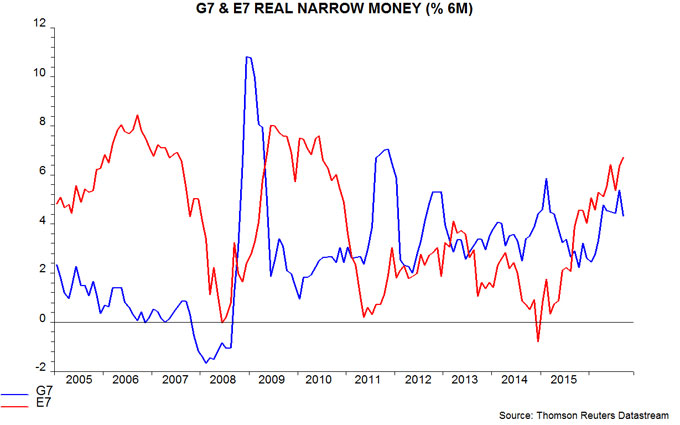
Six-month real narrow money growth rates are similar across the major developed economies. Japan remains at the top, consistent with recent equity market outperformance, with the UK in the middle, arguing against the consensus view that UK GDP growth will be below the G7 average in 2017 – sixth chart.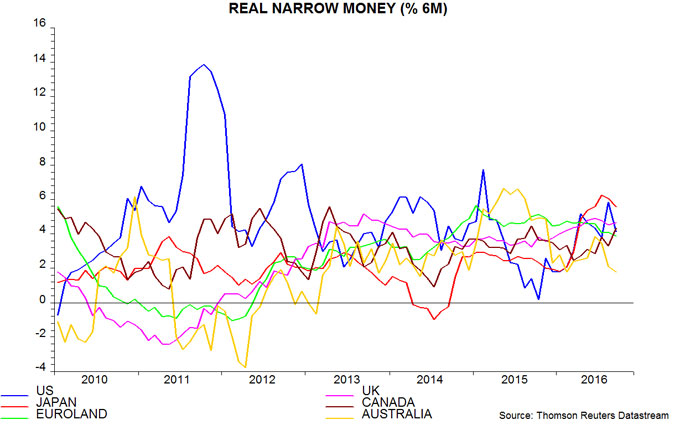
In the E7, Indian real narrow money growth has surged to match Chinese buoyancy. Brazilian weakness is abating but a renewed contraction in Russia suggests that recovery hopes will be disappointed – seventh chart.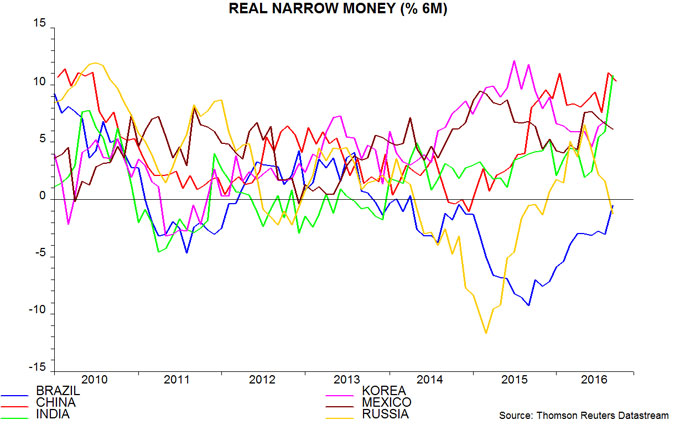
UK money trends strong, nominal GDP to accelerate further
The UK economic outlook was uncertain in the wake of the Brexit vote. The provisional assessment here was that the economy would slow significantly but that official / consensus forecasts of stagnation or recession would be proved wrong. This assessment, however, was subject to revision depending on post-referendum monetary trends.
Three months on, it appears that the provisional assessment was unduly conservative. Monetary trends have remained strong since the referendum and suggest rising nominal GDP growth with stable real-terms expansion.
The preferred narrow and broad monetary aggregates here are non-financial M1 and M4, covering money held by households and private non-financial firms. M1 comprises notes / coin and sterling sight deposits; M4 also includes sterling time deposits, money funds, repos and short-term bank securities. These measures grew at annualised rates of 10.5% and 7.8% respectively between end-June, just after the referendum, and end-September. The Bank of England’s M4ex broad money aggregate expanded at a 10.0% rate over the same period, boosted by rapid growth of deposits held by insurance companies / pension funds, unit / investment trusts, other fund managers and securities dealers – movements in such deposits, however, contain little information about near-term economic prospects (hence the preference here for non-financial money measures).
12-month growth rates of non-financial M1, non-financial M4 and M4ex were 10.2%, 6.8% and 7.7% respectively in September. The two broader aggregates are rising at their fastest pace since 2008. Non-financial M1 growth exceeded 10% between May 2013 and June 2014, ahead of several quarters of strong nominal and real economic expansion.
The 12-month growth rates have been trending higher since early / mid 2015. Swings in non-financial M1 growth have consistently led those in nominal GDP expansion in recent years – see first chart. Annual nominal GDP growth rose between the third quarter of 2015 and the second quarter of 2016, and is likely to have increased further last quarter, based on last week’s preliminary real GDP estimate. (A first estimate of nominal GDP for the third quarter will be released on 25 November.) Monetary acceleration suggests that the pick-up will extend into spring 2017, at least.
Faster nominal GDP growth is likely to be driven by higher inflation, with output expansion broadly stable. The second chart shows two-quarter / six-month changes in real GDP and the money measures deflated by consumer prices. Growth of real non-financial M1 / M4 remains strong but has moderated slightly, reflecting a recovery in consumer price momentum. GDP may continue to rise at its recent pace of 2-2.5% annualised through next spring. The consensus forecast of 1.0% growth in all of 2017 (October Treasury survey, revised up from 0.7% in September) looks much too low.