Entries from October 16, 2016 - October 22, 2016
Global acceleration watch: US business investment
US business investment fell by 0.5% in the year to the second quarter but is expected here to rebound during the second half and into 2017, contributing to a rise in GDP growth. Recent evidence is consistent with this forecast.
Reasons for expecting investment to strengthen include: corporate profits have recovered since late 2015; corporate bond yields have fallen significantly; capacity utilisation is little changed despite sluggish growth; money holdings of non-financial businesses are rising solidly (by 5.8% in the year to June); the corporate liquidity ratio (i.e. liquid assets divided by short-term liabilities) is above its historical average; so is Tobin’s Q ratio (i.e. the market value of equity is high relative to the replacement cost of assets, implying an incentive to invest); and capital spending cuts in the energy sector have ended.
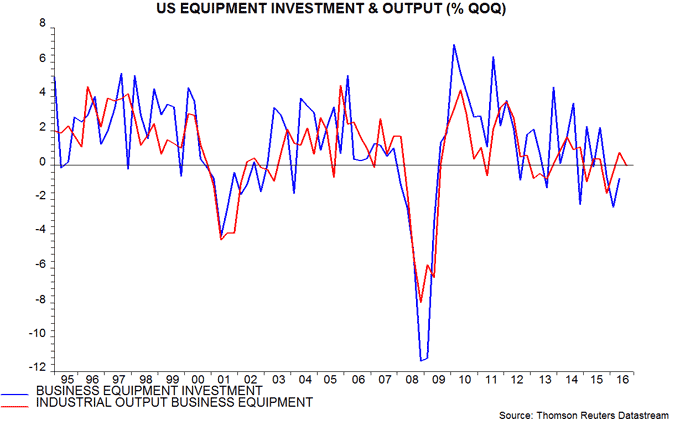
Equipment spending accounts for 46% of business investment. Industrial output of business equipment rose in the second quarter and was stable in the third quarter. This increase suggests that next week’s third-quarter GDP release will report a recovery in equipment spending following three quarterly falls – see first chart.
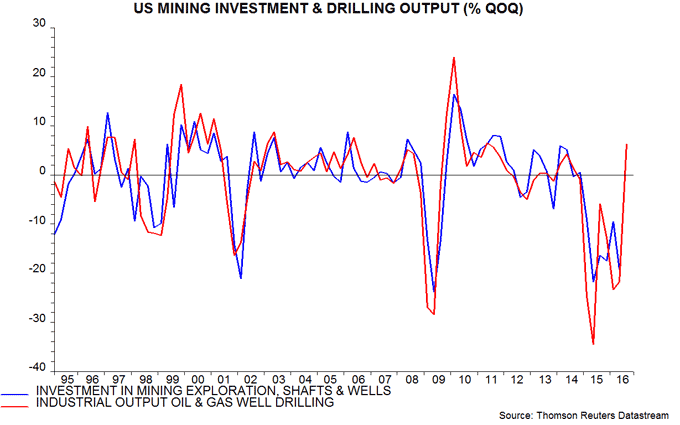
Structures investment accounts for a further 21% of the business total and has been depressed by a collapse in mining exploration. The industrial output component covering oil and gas well drilling, however, rose in the third quarter, suggesting that mining and overall structures investment returned to growth – second chart.

Spending on “intellectual property products”, mainly software and R&D, accounts for the remaining 33% of business investment. It rose by 4.8% in the year to the second quarter and is likely to have continued to grow strongly in the third.
UK Q3 GDP to confirm economic resilience, embarrass Treasury
Available evidence suggests that the preliminary estimate of third-quarter GDP to be released on 27 October will show quarterly growth of 0.4-0.5%, following a 0.7% second-quarter gain. This compares with the Treasury’s pre-EU referendum projection of a 0.1% GDP fall in the third quarter in the event of a Brexit vote in its milder “shock” scenario, and a 1.0% decline in its alternative “severe shock” scenario.
The 0.4-0.5% prediction reflects the following considerations:
-
GDP in July is estimated to have been 0.4% above the second quarter level, based on monthly output data for services, industry and construction.
-
The services turnover report for August released yesterday suggests that output in the sector rose slightly further (or July’s increase was slightly larger than currently estimated)*. The projected gain offsets the impact of already-reported August falls in industrial and construction output.
-
The GDP number will incorporate Office for National Statistics estimates of sectoral output in September. These estimates will be based partly on statistical models that are likely to extrapolate recent growth.
Solid third-quarter growth – if confirmed – does not, of course, imply that the Brexit vote has had no negative impact, nor that forecasts of economic weakness will not prove correct over a longer time horizon. The view here will continue to be guided by monetary trends, which suggest that growth will remain respectable through spring 2017, at least – see previous post.
The Treasury’s inaccurate projection reflects two mistakes: like most other forecasters, it significantly underestimated the economy’s momentum at the time of the vote; and its assessment of the impact of a Brexit outcome was based on implausibly negative assumptions about uncertainty effects and financial conditions. The forecast of a recession, indeed, appeared to have been reverse engineered – see previous post.
*The relationship between the turnover and output data was discussed in a previous post.
Chinese activity data mostly positive
There were two pieces of good news and one disappointment in today’s Chinese activity data.
Annual growth of nominal GDP rose further to 7.8% in the third quarter, the fastest for two years and up from a low of 6.0% in the third quarter of 2015. Growth of real GDP was stable at 6.7%, while the annual increase in the GDP deflator firmed from 0.6% to 1.0%. The nominal pick-up was predicted by a rise in money growth from spring 2015, with the latest monetary data suggesting further acceleration – see first chart and yesterday’s post.
The second positive was a further recovery in private fixed asset investment, which rose by an annual 4.5% in September, having fallen 1.2% in June. The investment revival follows a strong rebound in profits and robust growth in money holdings of non-financial enterprises (NFEs) – second chart.
The disappointment was that annual industrial output growth slipped from 6.3% in August to 6.1% in September. Industrial activity has been held back factory closures in “old economy” activities – coal output, for example, fell by 12.3% in the year to September. The rebalancing of the economy away from heavy industry is evidenced by electricity consumption data: annual growth in the tertiary (services) sector was 14.9% in September versus 1.5% for secondary industry (i.e. manufacturing).
Pessimists argue that GDP growth has been boosted by temporary stimulus measures (e.g. auto sales incentives due to expire at end-2016) and an overheated housing market, which the authorities are now taking steps to cool. The view here is that a renewed economic slowdown is unlikely given monetary trends, an emerging investment recovery and the current leadership’s desire to maintain solid growth ahead of the autumn 2017 party congress, when key positions will be allocated.
Chinese money trends signalling ongoing reflation
Chinese monetary growth remained strong in September, supporting expectations that the economy will continue to reflate despite administrative attempts to cool an overheating housing market.
The preferred broad money aggregate here is M2 excluding financial deposits – the latter have fluctuated widely in recent years but have little connection to money spending. Annual growth of this measure was stable at 12.8% in September, more than double a low of 6.3% in June 2015 and the fastest since 2013 – see chart.
Total M2 growth was lower at 11.5%, reflecting a fall in financial deposits over the past 12 months. M2 ex financial deposits has been a superior economic gauge in recent years, signalling the 2014-15 downturn as well as this year’s recovery. M2 was misleadingly strong in 2014-15 as financial deposits surged.
Annual M1 growth, meanwhile, remained buoyant at 24.7% in September, down from 25.3% in August. As previously discussed, the Chinese M1 definition omits household demand deposits, which are added back here to create “true” M1. Such deposits grew by an annual 16.0% in September, while demand deposits of non-financial enterprises and government organisations rose 28.3%. Annual true M1 growth was 21.7% in September versus 22.1% in August.


