Entries from October 9, 2016 - October 15, 2016
Global acceleration watch: corporate profits
The forecast here that global growth will pick up into 2017 rests importantly on an assumed recovery in business spending. Firms are expected to turn more expansionary partly in response to a recent revival in profits.
The first chart shows annual rates of change of S&P 500 reported earnings*, incorporating a bottom-up Capital IQ consensus estimate for the third quarter, and Chinese industrial profits, as reported by the National Bureau of Statistics. Chinese profits resumed growth in early 2016 and are rising at their fastest pace since 2013. US earnings seem to be following.
The second chart shows the IBES consensus estimate for MSCI World 12-month-forward earnings per share (EPS) in US dollars, along with the “revisions ratio” – the number of analyst upgrades in the latest five weeks minus downgrades, expressed as a proportion of the total number of estimates (and seasonally adjusted). The forward EPS estimate has been trending higher since early 2016, while the revisions ratio is the strongest since 2014.
*Total index earnings not earnings per share.
UK 2017 inflation rise: blip or ratchet?
UK consumer price inflation is expected here to rise above 3% during 2017, exceeding Monetary Policy Committee (MPC) and consensus forecasts. The MPC is likely to try to avoid tightening policy in response, arguing that it intends to “look through” the increase, an approach it claims was successful in 2008 and 2011, when CPI inflation reached over 5% before falling back. Monetary growth, however, is much stronger than in those years, suggesting that the coming inflation rise will represent a permanent upward shift rather than a “temporary blip”. In reality, key MPC officials may now be covertly in favour of aiming for a sustained overshoot of the inflation target, a policy recently embraced explicitly by the Japanese monetary authorities.
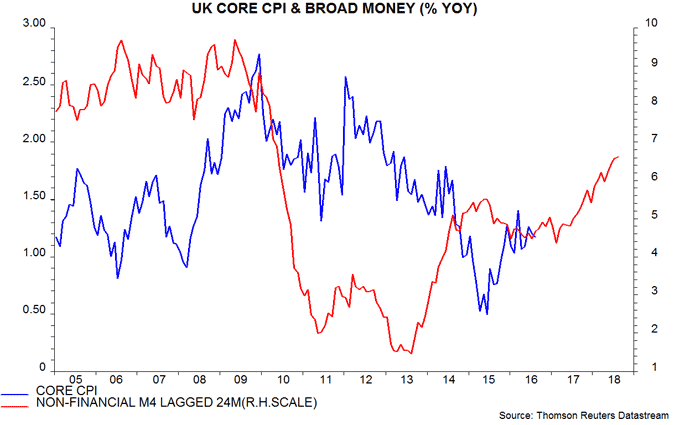
A post in May presented long-term evidence showing that all major swings in “core” inflation (i.e. excluding food / energy costs, tax effects etc) since World War 2 were preceded by a significant change in monetary growth, typically by between two and three years. Annual broad money growth, as measured by non-financial M4, has been trending higher since 2011, reaching 6.6% in August, the fastest since 2008. Monetary forces, therefore, will be pushing up on inflation in 2017 and 2018 – see first chart*.
The rise in core inflation to date has been delayed and muted by the lagged impact of exchange rate strength over 2013-15. The currency effect, of course, is about to become a powerful tailwind. Manufactured import prices rose by 7.3% in the year to August and annual growth is likely to reach 10-15% by early 2017, barring a significant recovery in sterling. Import price changes appear to have their maximum impact on core CPI inflation after about a year, suggesting strong upward pressure from late 2016 – second chart.
Core CPI inflation, therefore, is expected here to rise from 1.2% in August to about 2.5% by late 2017. Headline CPI inflation, meanwhile, is likely to be pushed significantly above the core rate by rising energy and food prices due to sterling weakness and stronger global commodity costs. Based on current sterling commodity prices, the headline-core inflation gap may increase to over 1 percentage point by mid-2017 – third chart. Combined with a strengthening core trend, this would probably be sufficient to lift the headline rate above 3%.
The CPI inflation surges in 2008 and 2011 proved temporary partly because they occurred against a backdrop of weak and falling monetary growth – the annual increase in non-financial M4 bottomed at 2.0% in 2009 and 1.5% in 2011. Recent strong growth has yet to peak, suggesting that core CPI inflation will remain under upward pressure until late 2018, at least. The coming inflation overshoot, therefore, is likely to be sustained, unless global commodity prices turn down afresh or sterling stages an improbable large recovery.
*Core CPI = CPI excluding energy, food, alcohol, tobacco and education, and adjusted for VAT changes.
Global acceleration watch: OECD leading indicators
The assessment here is that the global economy has been gaining momentum since mid-year and growth over the next six to 12 months will be significantly stronger than expected by policy-makers and the consensus. This series of short posts will highlight incoming evidence that supports, or refutes, this view.
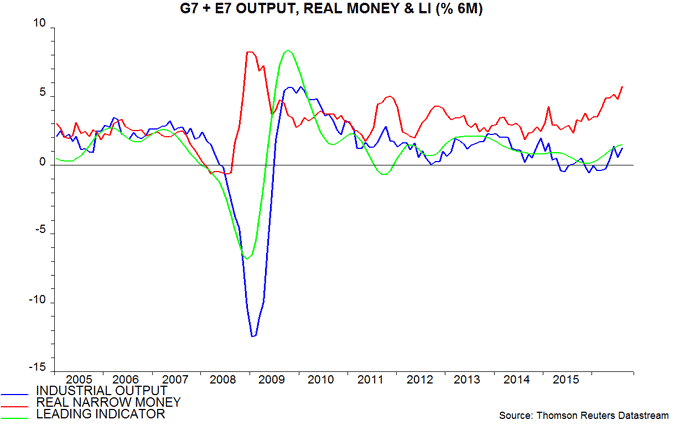
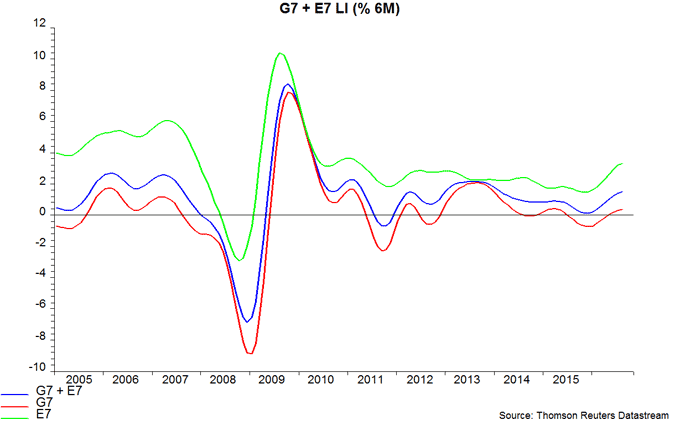
The OECD yesterday released August data for its country leading indicators, allowing calculation of the composite G7 plus emerging E7 leading indicator tracked here. Six-month growth of the latter rose further – see first chart. Both G7 and E7 components contributed to the increase – second chart.
The rise in leading indicator growth from a low in December 2015 follows a pick-up in G7 plus E7 six-month real narrow money expansion from a bottom in August 2015. The further increase in real money growth to a seven-year high in August 2016 suggests that the indicator will continue to gain momentum.


