
Entries from August 14, 2016 - August 20, 2016
US business investment reviving
 Simon Ward
 Post a Comment
The suggestion in a previous post that a recovery in US business investment will contribute to significantly stronger second-half GDP growth is supported by July industrial output data.
Equipment spending accounts for 46% of business investment (i.e. private non-residential fixed investment). Six-month growth of industrial output of business equipment rose to 2.0% in July, the fastest since 2014. Output and investment numbers are, unsurprisingly, closely correlated – see first chart.
Structures investment accounts for a further 21% of the business total and has been even weaker than equipment spending, mainly reflecting a collapse in mining exploration. The industrial output component covering oil and gas well drilling, however, bottomed in May, edging higher in June and July. The recovery in the oil price, meanwhile, suggests a significant rebound in both output and investment over the remainder of 2016 – second chart.
Spending on “intellectual property products”, mainly software and R&D, accounts for the remaining 33% of business investment; it continues to grow strongly.
Business investment fell by 1.4% during the first half (i.e. between the fourth quarter of 2015 and the second quarter of 2016), subtracting 0.18 percentage points (pp) from GDP growth, or 0.36 pp at an annualised rate. A reasonable base case is that this decline will be fully reversed during the second half, implying that business investment alone could contribute 0.72 pp to the change in annualised GDP growth between the first and second halves.
The change in inventories subtracted a further 0.79 pp from annualised GDP growth during the first half but is expected here to have a neutral impact at worst during the second half . Total business spending, therefore, may deliver a boost of more than 1.5 pp to second-half GDP expansion.


UK vacancies softer but not suggesting economic contraction
UK vacancies data covering July suggest that the economy has slowed sharply but is not contracting – contrary to the recessionary message from the high-profile but often unreliable purchasing managers’ surveys, which appear to have played a key role in the MPC’s decision to launch further policy easing.
The vacancies numbers are reported on a three-month moving average basis. The average fell from 744,000 in June to 741,000 in July, a decline of 0.4%. A previous post argued that vacancies would need to fall by 4% over three months to suggest that the economy is contracting, based on the historical relationship with gross value added (GVA). The decline between June and July is beneath the implied monthly threshold of 1.3%.
The chart shows fitted values of a regression of quarterly non-oil GVA growth on the three-month change in vacancies. The latest three-month change (i.e. a decline of 0.9% between April and July) suggests weak GVA expansion.
The Office for National Statistics makes available the monthly non-seasonally-adjusted data underlying the reported three-month moving average. This single-month series, adjusted for seasonal factors using the X-12 procedure, fell by 1.0% between June and July – also below the contraction threshold.
The July vacancies number tallies with the Reed job index, a measure of online listings, which edged lower last month but remains close to a May peak – see the previous post for more discussion and a chart. The Reed index is released two weeks before the official vacancies number, with an August reading due in early September.
Claimant-count unemployment, meanwhile, fell by 8,600 in July, the first decline since February, defying expectations of a sizeable rise. This series, while timely, usually lags economic activity and may have been distorted as an indicator recently as claimants have been moved from job-seeker's allowance to universal credit.
The July vacancies number is modestly reassuring but the assessment of the economic outlook here will depend on post-Brexit vote monetary trends, with July data scheduled for release on 30 August.
China data summary: more positives than negatives
Chinese activity and money / credit data for July were mixed but are interpreted here as supporting a positive view of near-term prospects.
Annual industrial output growth edged lower in July but the six-month rate of increase rose to its strongest level since 2014, based on the World Bank’s seasonally-adjusted level series – see first chart. A rebound in steel output has contributed to the recent pick-up and may be a positive signal for prospects – steel output is a component of the OECD’s Chinese leading indicator.
The rise in six-month industrial output growth accords with the Markit / Caixin manufacturing purchasing managers’ index, which moved above the 50 level last month for the first time since February 2015.
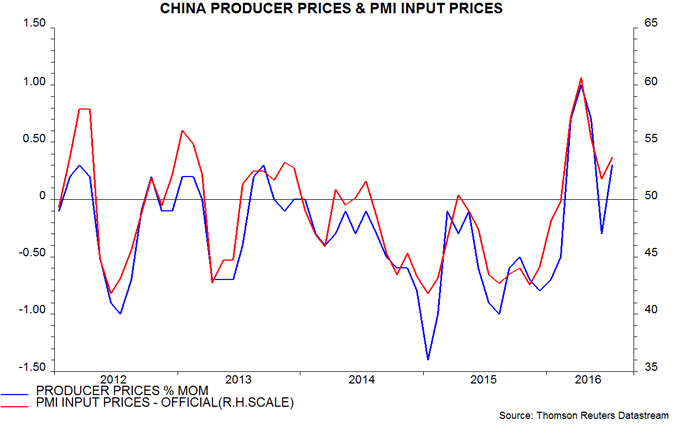
Pessimistic commentary has focused on a further slowdown in fixed asset investment, with the private sector component contracting in the year to July – second chart. The working assumption here is that private investment has been adjusting to lower economic growth and a fall in profits in 2014-15. With profits now recovering, and non-financial enterprise deposits rising strongly, a turnaround may be imminent – third chart. The profits rebound partly reflects an easing of deflationary pressures, with producer prices rising in four of the last five months – fourth chart.
Annual growth in housing sales and starts peaked in March but has remained positive, recovering slightly in July – fifth chart.
Exports could provide a fillip during the second half. The average level of the renminbi against the PBoC’s currency basket so far in August is 7.5% lower than during the second half of 2015, while global demand appears to be firming. A recent recovery in container freight rates, as measured by the Shanghai shipping exchange’s composite containerised freight index, is a promising sign – sixth chart.
Narrow money growth remains buoyant: the annual rise in true M1, comprising currency in circulation and demand / temporary deposits of non-financial enterprises, government organisations and households, edged up to 21.8% in July, the highest since 2010 – seventh chart*. It has been argued that demand deposits have been boosted by side-effects of the local government debt swap programme and rapid expansion of wealth management products but such explanations cannot account for the extent and persistence of recent strength. Household as well as corporate deposits have grown robustly – up by an annual 15.0% in July.
Annual growth of the broader M2 measure fell to 10.2% in July, a fifteen-month low, but the recent decline is entirely explained by deposits of non-bank financial institutions – these surged in 2014-15 but are now contracting. Swings in such deposits are unlikely to be relevant for assessing immediate economic prospects. M2 excluding financial-sector deposits, by contrast, has accelerated over the past year: annual growth of 12.3% in June was the strongest since 2013, with July little changed at 12.1% – seventh chart.
The preferred aggregates here, therefore, suggest that annual nominal GDP growth will continue to recover during the second half, following a rise from 6.0% to 7.3% between the third quarter of 2015 and the second quarter of 2016 – eighth chart.
*The official M1 aggregate omits household deposits.
