
Entries from July 24, 2016 - July 30, 2016
UK money trends strong pre-Brexit vote
 Simon Ward
 Post a Comment
There is no negative message for UK economic prospects in June monetary data. Narrow money, broad money and bank lending all grew solidly on the month, maintaining recent upbeat trends. The suggestion is that the economy was on course to expand strongly before the Brexit vote shock, offering hope that existing momentum will avert any near-term contraction of demand and output. The June numbers incorporate only one week of post-vote flows – July / August data will be much more important for assessing economic prospects.
The favoured narrow and broad money measures here are “non-financial” M1 and M4, comprising money holdings of households and private non-financial corporations (PNFCs). These measures grew by 1.0% and 0.6% respectively in June, while bank lending to households and PNFCs gained 0.4%.
Annual growth of non-financial M1 rose to 9.3%, the fastest since 2014. Non-financial M4 growth climbed to 6.4% and bank lending expansion to 4.0%, the fastest since 2008 and 2009 respectively – see first chart.
The forecasting approach here focuses on the six-month rate of change of real (i.e. inflation-adjusted) non-financial M1. A rise in this measure starting last autumn suggested that GDP momentum would firm during 2016; stronger second-quarter growth reported this week is consistent with this forecast. Real non-financial M1 expansion has continued to pick up, closing in on its 2013 high in June – second chart.
Previous posts expressed concern that narrow money strength reflected the household component while corporate M1 was slowing, suggesting rising business caution. Corporate M1 turned down ahead of household M1 before the 2008-09 recession. Six-month growth of real PNFC M1, however, rebounded sharply in June, returning to its level in late 2015 / early 2016 – third chart. Corporate as well as household narrow money trends, therefore, were positive before the Brexit vote.
Other noteworthy features of the June statistics include:
-
Annual growth of the Bank of England’s favoured broad money measure, M4ex, rose to 5.8%, the fastest since 2008. M4ex equals non-financial M4 plus money holdings of some financial institutions (i.e. excluding intermediaries). (Financial sector money is volatile and less relevant for assessing prospects for spending on goods and services.)
-
Broad money growth was depressed in 2015 by households switching out of bank deposits into National Savings products – in particular, the high-interest pensioner bonds made available for a brief period before the election. (Such products are excluded from M4.) This effect has reversed in 2016 – there was net outflow from National Savings in May and June. A wider measure of non-financial liquidity comprising non-financial M4 and the stock of National Savings rose by an annual 6.3% in June, below a recent peak of 6.7% reached in November 2015.
-
While bank lending to households and PNFCs grew by an annual 4.0% in June, total (M4Lex) lending – i.e. including loans to non-intermediate financial institutions – rose by a much faster 6.8%. Lending to such institutions surged by 35.8%. This appears to reflect borrowing by or on behalf of pension funds in connection with liability-driven investment strategies.
-
External and foreign currency flows had a large positive impact on M4 in June, suggesting that the balance of payments non-bank capital account was in significant surplus. A possible explanation is that investors moved funds into the UK ahead of the referendum in anticipation of a remain victory. This would accord with exchange rate behaviour – the pound reached its high for the year against the US dollar on the day of the vote before collapsing in response to the shock result.
EU UK July surveys less negative than PMIs
Survey evidence is regarded here as of limited use for tracking and forecasting economic developments. It may, however, be noteworthy that the EU Commission’s UK business and consumer surveys for July released today are less bleak than last week’s “flash” PMIs.
The Commission calculates an “economic sentiment indicator” (ESI), which is a weighted average of confidence measures covering consumers, services, industry, retailing and construction. These confidence indicators are derived from surveys conducted by GfK (consumers), the CBI (services, industry and retailing) and Experian (construction). The ESI fell to a three-year low in July but remains above its long-run average, represented by the 100 level – see first chart.

The correlation of the ESI with annual GDP growth is unimpressive (+0.71 over 1997-2015). However, it plunged below 70 during the 2008-09 recession and reached 90 during the recession scares of 1998 (after the Asian crisis) and 2011-12 (the phantom “double dip”).
There are two obvious construction problems with the ESI. First, the weights used to combine the confidence indicators do not reflect the structure of the UK economy – industry, for example, is assigned a 40% weight versus 30% for services, despite the much greater importance of the latter in the UK.
Secondly, the confidence indicators combine assessments of recent and expected conditions. The July readings, therefore, incorporate an element of pre-referendum economic strength.
The second chart includes an alternative indicator that combines the more forward-looking elements of the surveys (e.g. expected demand or orders) with appropriate weights. This indicator fell much more sharply than the ESI in July and is below its long-run average, but not at levels suggestive of a recession. Its correlation with GDP growth, admittedly, is little different from that of the ESI (+0.72).

As previously discussed, the assessment of economic prospects here will be influenced importantly by monetary data, starting with end-June statistics released tomorrow. An oncoming recession would probably be signalled by a contraction of household / corporate narrow money holdings as spending plans were cut back.
Eurozone money trends stable / solid
Eurozone monetary trends are stable, suggesting that GDP will continue to expand at a 1.5-2% annualised pace. While unimpressive, such growth would be above estimates of “potential” expansion, implying a further reduction in unemployment.
Six-month growth of real narrow money, as measured by non-financial M1, was unchanged at 4.6% (9.3% annualised) in June, close to its average since the start of 2015. Household and corporate M1 deposits are expanding at similar solid rates – see first chart. 
Any negative impact of the UK’s Brexit vote on Eurozone confidence and spending intentions would be expected to be reflected in a slowdown in narrow money. The latest data refer to end-June, i.e. only one week after the Brexit vote; any slowdown would be more likely to show up in July / August, but is not expected here.
Six-month growth of real broad money, M3, is similarly close to its average since the start of 2015. Growth of real bank lending is higher than its corresponding average – second chart.
GDP rose by 1.7% in the year to first quarter of 2016, with domestic demand up by 2.1%. Stable monetary trends suggest that demand will continue to expand at about a 2% pace, while a stronger global economy may reduce or reverse the recent drag from net exports. GDP growth, therefore, may remain comfortably above its potential rate, estimated at between 0.9% and 1.1% in 2016 by international forecasting bodies.
Real M1 deposit growth is still solid across the big four economies, though has cooled recently in France and Spain – third chart. Real bank deposits are expanding again in Greece, a hopeful signal – fourth chart.

UK Q2 GDP strong, money data awaited for H2 assessment
Posts in December and March argued that UK growth was in an upswing phase, contrary to mainstream forecasts of a slowdown or even stagnation. Today’s news that GDP grew by 0.6% in the second quarter confirms that momentum had strengthened before the EU referendum but the outlook, of course, has been transformed by the result of the vote. The judgement here about the damage to economic prospects will depend importantly on post-referendum monetary trends, with end-June data to be released on Friday.
The strong second-quarter result reflected another solid gain in services output coupled with a rebound in industrial production after weakness over the winter. Monthly output data imply that GDP rose sharply in April but retreated in May, with the Office for National Statistics projecting a small increase in June. April strength was payback for weak March activity, which was probably affected by the early timing of Easter – see first chart.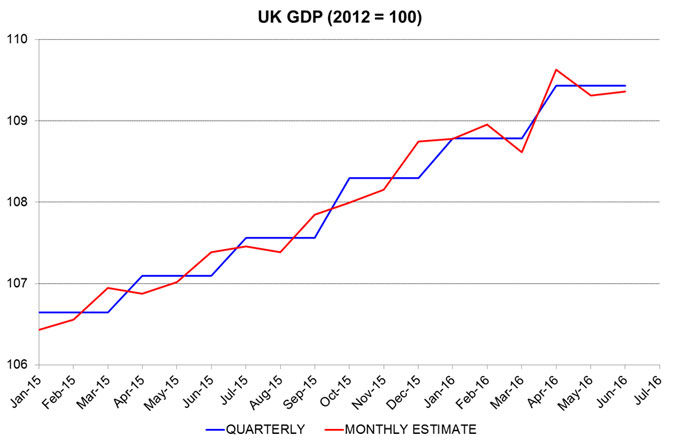
The GDP result highlights the danger of relying on survey evidence to assess economic developments. The compiler of the purchasing managers’ surveys had predicted growth of just 0.2% last quarter, based on its “composite PMI”. The flash July results released last week, it now claims, indicate that GDP is on course to fall by 0.4% in the current quarter.
The working assumption here is that the economy is unlikely to weaken sharply against a backdrop of rising global growth and stable financial conditions. A firm assessment, however, will depend on narrow money developments in July / August. As previously discussed, a slowdown in corporate* real narrow money this spring suggested that economic prospects were dimming; a post-referendum move into contraction would support recession worries – second chart.
*Private non-financial corporations (PNFCs).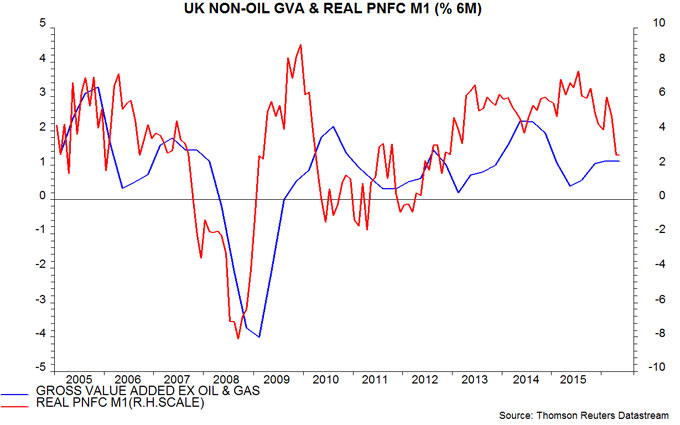
Global economy still firming
The view here that an upswing in global economic growth is under way and will not be derailed by “Brexit” received support from last week’s “flash” purchasing managers’ surveys for July, showing stronger results in the US and Japan and little change in the Eurozone, despite the expected UK slump.
There were no flash results for China but the Market News International business sentiment indicator rose further last month to its highest level since October – see here.
The American Chemical Council today released a July reading of its chemical activity barometer – a leading indicator of the general economy that exploits the chemical industry’s sensitivity to cyclical changes. Six-month growth in the barometer rose further to its fastest since 2011 – see first chart.
US second-quarter GDP numbers later this week are expected to show a recovery in growth despite a decline in stockbuilding last quarter. A rebound in real narrow money expansion in late 2015 had suggested that economic momentum would revive around mid-2016 and money numbers through early July continue to give a positive signal – second chart.


UK MPC model suggesting moderate easing package
A model of the MPC’s historical “reaction function” suggests that the Committee will cut Bank rate by 25 basis points (bp) to 0.25% at its August meeting, based on current economic and financial information. The model forecast would be consistent with several members (Haldane, Vlieghe?) voting for more significant action but others (Forbes, McCafferty?) favouring “patience” or judging growth / inflation risks to be balanced.
A further possibility is a smaller rate cut (12.5 bp?) coupled with a modest QE programme (£30 billion over three months?) – such an approach has merits given uncertainty about the benefits / costs of moving rates towards zero. A less likely but more radical option would be for the MPC to move to an ECB-style dual-rate system, paying a “Bank rate” of 0.5% or 0.25% on the bulk of banks’ reserves but imposing a zero or negative rate on the top tier.
The “MPC-ometer” model attempts to explain the “average vote” of Committee members using information known before the start of each month’s meeting. If five members vote for a 25 bp rate cut and the other four for no change, the average vote is -14 bp (five-ninths of 25 bp). QE is allowed for by assuming that a 25 bp rate cut is equivalent to £75 billion of QE*. The model was estimated using historical data since the MPC’s inception in 1997.
The model’s inputs are grouped into indicators of economic growth, inflation and financial market conditions. Growth indicators include the quarterly change in GDP, manufacturing and services purchasing managers’ indices (PMIs) and consumer confidence. The inflation indicators are the deviation of current inflation from target, average earnings growth, consumer inflation expectations and manufacturing firms’ price-raising plans. Financial market indicators include short-term government bond yields, share prices, the effective exchange rate and the interbank / Treasury bill rate spread. The model also takes account of any vote dissents at the prior meeting and inter-meeting signals from individual members (such as Weale’s indication that he will vote to ease in August).
If the MPC changed policy only by moving Bank rate by 25 bp or adding / subtracting to QE in £75 billion chunks, the MPC-ometer would signal action if the forecast average vote moved above +12.5 bp (tightening) or below -12.5 bp (easing). The lower panel of the chart compares the historical fitted values of the model with the implied “unchanged policy range” of +/-12.5 bp, shown shaded. It can be seen that movements outside this range are usually associated with Bank rate changes or – since 2009 – expansions of QE.

The current model forecast for August is -21 bp, the lowest since July 2012, at the height of the Eurozone crisis and during a period of expanding QE. This forecast assumes that tomorrow’s second-quarter GDP release will show quarterly growth of 0.5%, in line with the consensus estimate. The key drivers of the large change this month are the post-referendum slumps in the PMIs and consumer confidence, and a fall in short-term government bond yields.
The forecast is unlikely to change significantly before the MPC vote on 3 August. Apart from the GDP release, a revision could be prompted by final PMI and consumer confidence readings – to the extent that these differ from flash estimates – or movements in markets.
The model is based on average MPC behaviour since its inception. It is possible that the current Committee membership has a different reaction function but there is no evidence that the model has “broken down” in recent years – the stability of policy since 2012 is in line with the average vote forecast, which has remained within the “unchanged” range.
*This assumption maximises the model’s historical fit with MPC behaviour; it does not imply that these alternatives have the same effects on economic growth and inflation.
