
Entries from June 5, 2016 - June 11, 2016
Solid UK activity data at odds with survey pessimism
 Simon Ward
 Post a Comment
UK industrial and construction output numbers for April released this week cast doubt on the widespread view that economic growth has slowed. This view rests mainly on weaker business surveys that may have been “contaminated” by Brexit uncertainty.
Industrial output surged by 2.0% in April while construction output rebounded by 2.5% after a 3.7% March decline. The two sectors account for 21% of gross value added (GVA). April output for the dominant services sector will be released on 30 June. If it were to rise by 0.2%, in line with the average monthly increase over the last 12 months, the monthly GDP proxy tracked here would grow by 0.6%, to stand 0.4% above its first-quarter level – see first chart.
GDP growth in the second quarter, that is, would be on course to match or exceed a 0.4% first-quarter gain. Most economists, by contrast, expect GDP to slow, or even stagnate, in the current quarter.
Retail turnover is a component of services output and has already been reported to have risen by 1.3% in April, implying a contribution of +0.1 of a percentage point to the monthly output change.
The strength of these April activity series after relative weakness in March may partly reflect seasonal adjustment problems due to the early timing of Easter this year.
Previous posts (e.g. here) expressed optimism about UK economic prospects based partly on solid money / credit trends. Six-month growth of real (i.e. consumer-price-deflated) narrow money, as measured by non-financial M1*, was stable in April at its highest level since December 2013 – second chart.
*Notes / coin and sterling sight deposits of households and private non-financial corporations.
Global leading indicators confirming positive monetary signal
The forecasting approach here uses non-monetary leading indicators to confirm signals from narrow money trends. Both are now giving a strongly positive message for global economic prospects.
The OECD yesterday released April data for its country composite leading indicators. A recovery in the US indicator was confirmed – see Tuesday’s post – while a number of other countries also registered a significant improvement.
The first chart below shows a “global” leading indicator calculated by combining data for the G7 and emerging E7 countries. The six-month and one-month changes in the indicator strengthened further in April. A cyclical upswing in the indicator is clearly now under way.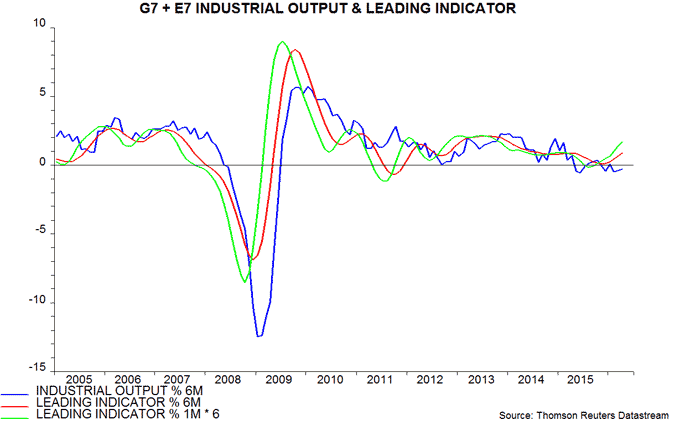
A study* of G7 data since the 1960s showed average lead times of real narrow money and the leading indicator with respect to industrial output of nine and six months respectively. The six-month change in global real narrow money bottomed in August 2015, with that of the leading indicator following in November – consistent with the historical three-month gap. The suggestion is that the six-month change in industrial output will recover from May, rising at least through October (based on the leading indicator) or January 2017 (based on monetary trends). 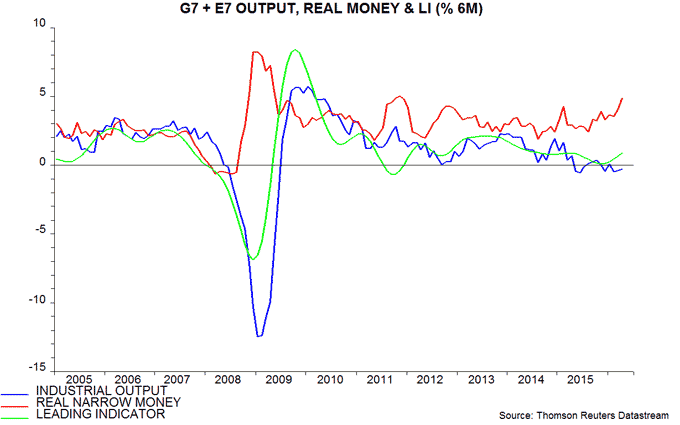
Both the G7 and E7 leading indicator components have turned up convincingly – third chart. The E7 pick-up is more impressive, reflecting recoveries in Russia and Brazil as well as China, and further strength in India.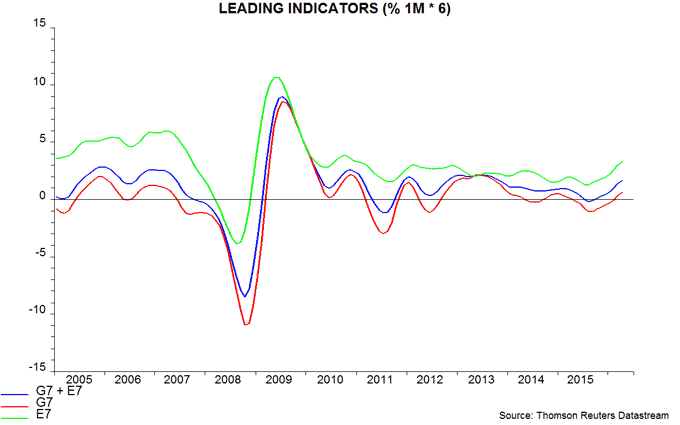
Real narrow money and the leading indicator signal cyclical direction rather than the level of economic growth. The breadth of improvement in monetary and leading indicator trends across countries, however, suggests the potential for a significant positive growth surprise in late 2016.
*Available on request.
UK monetary data suggesting capital / sterling outflow
A Bank of England data series* measuring the impact of “external and foreign currency flows” on the M4 money supply suggests that investors have moved funds out of the UK and / or sterling since late 2015, probably because of the EU referendum.
The numbers are highly volatile on a monthly basis but show an outflow of £77 billion in the six months to April, up from £2 billion in the previous half-year and the largest since 2012 – see chart.
The item “external and foreign currency flows”, or equivalently “monetary financial institutions’ (MFI) externals”, measures the combined change in the banking system’s net external asset position and its net foreign currency lending to UK non-banks. The change in net external assets, as a matter of accountancy, equals the sum of the balance of payments current account and the capital account of UK non-banks. A fall in net external assets, therefore, indicates a deficit on the current and non-bank capital accounts.
A fall in banks’ net foreign currency lending to UK non-banks, meanwhile, implies that non-banks have reduced their exposure to a decline in sterling.
The current account deficit was £33 billion in the fourth quarter of 2015. Assuming that it has remained stable, the implied shortfall over six months is £66 billion – below the £77 billion external and foreign currency outflow in the six months to April. This suggests that the non-bank capital account moved into deficit over this period and / or UK non-banks cut their net foreign currency borrowing from UK banks.
The claim that foreigner investors have reduced their exposure to the UK is supported by the May Bank of America / Merrill Lynch global fund manager survey, showing a net 36% of asset allocators underweight UK equities – the largest negative balance since November 2008.
*Bankstats Table 3.2, series identifier VRIG or ABVW.

US money trends / leading indicator signalling growth rebound
Previous posts (e.g. here) suggested that US GDP growth would remain sub-par in the second quarter while labour market data would soften in lagged response to earlier economic weakness, keeping the Federal Reserve on hold until September, at least. The weak May employment report released on Friday is consistent with this scenario.
While the small May payrolls rise partly reflected a strike at Verizon, other labour market indicators give little cause to expect an early significant rebound. Online help-wanted advertisements continued to decline in May, according to the Conference Board – see first chart. Temporary help jobs usually lead overall employment and fell in May – second chart.
Importantly, however, reduced hiring has yet to be accompanied by a pick-up in firing. Job cut announcements fell back sharply in May, according to Challenger, Gray and Christmas, while initial claims for unemployment insurance remain low – third chart. This reduces the risk of labour market weakness feeding back into a further economic slowdown.
The view here remains that the winter 2015 / spring 2016 “soft patch” is coming to an end and GDP growth will rebound significantly during the second half, with labour market conditions following with a lag. This rests primarily on a pick-up in real (i.e. inflation-adjusted) narrow money* since late 2015. Six-month growth of real narrow money reached a 14-month high in April and is estimated to have remained at this level last month, based on weekly data through 23 May. It has consistently led GDP growth turning points in recent years – fourth chart.
The positive monetary signal is receiving confirmation from the OECD’s composite leading indicator. Six-month and one-month changes in the indicator strengthened further in April, according to calculations here – fifth chart. The components of the indicator are: housing permits, new orders for durable goods, consumer sentiment, manufacturing weekly hours, the ISM manufacturing purchasing managers’ index (PMI), share prices and the spread between long- and short-term government bond yields. The recent upturn reflects recoveries in new orders, the PMI, weekly hours and share prices.
*M1A deflated by consumer prices. M1A = currency plus demand deposits.


