Entries from May 15, 2016 - May 21, 2016
Chinese industrial output on recovery trend despite April setback
Chinese activity numbers for April fell short of consensus expectations but are judged here to be consistent with a firming growth trend.
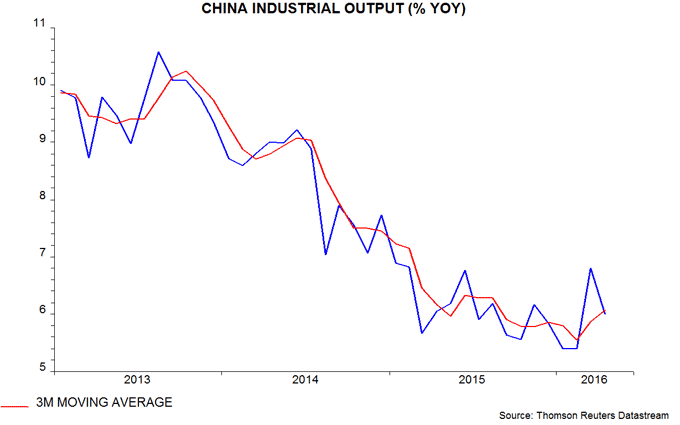
Annual industrial output growth fell back to 6.0% in April from 6.8% in March, a nine-month high. A previous post suggested that the late timing of the Chinese New Year in 2015 had depressed February 2016 growth relative to trend, with a corresponding overshoot in March. A normalisation was expected in April. A three-month average is a better guide to the trend and rose in April to its highest level since August – see first chart.
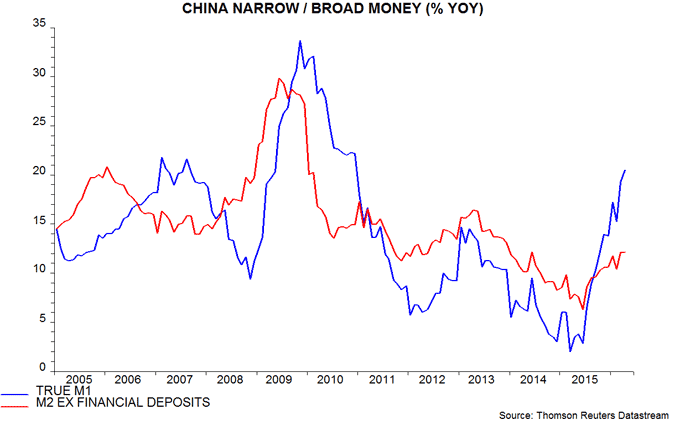
The PBoC this week released additional monetary data for April, allowing calculation of the “true M1” narrow money measure monitored here. Annual growth of this measure rose further to 20.5% last month, the fastest since 2010 – second chart.
The preferred broad money measure here is M2 minus financial sector deposits, which are less likely to be related to future spending on goods and services. Such deposits grew strongly in 2014-15 but have stabilised this year. Annual growth of M2 minus financial sector deposits has risen since mid-2015 and, at 12.1%, is in the middle of its range in recent years – second chart. Faster growth of narrow money reflects a switch from time deposits into demand / temporary accounts, consistent with rising spending intentions.

UK services turnover data suggesting economic resilience
UK services turnover strengthened in March, supporting the view here that economic growth remains solid, in contrast to downbeat consensus commentary.
The turnover survey is an important input to the services output index, which accounts for 79% of the output-based measure of GDP. Real turnover* fully reversed a fall in February to stand well above its fourth-quarter level – see first chart.
The estimate by the Office for National Statistics (ONS) that GDP rose by 0.4% in the first quarter assumed that services output grew by 0.2% between February and March. The turnover result suggests that this assumption will be met or exceeded. Revised GDP figures to be released on 26 May may confirm 0.4% growth for the economy as a whole last quarter but the increase in gross value added excluding oil and gas extraction could be revised up from 0.4% to 0.5%.
The consensus believes that the economy is slowing in the current quarter, with the Bank of England projecting a GDP rise of 0.3%. This belief, however, relies importantly on weaker business survey evidence that may have been “contaminated” by Breferendum uncertainty.
Any slowdown should prove short-lived assuming a Bremain vote, judging from upbeat money and credit trends – second chart.
Addendum: Revisions to GDP data up to 2014 released by the ONS today show stronger growth than previously reported in 2010, 2012 and 2014, offset by weaker outturns in 2011 and 2013. Annual growth in 2014 is now estimated at 3.1% versus 2.9% previously and a forecast here at the time of “about 3%”.
*Total ex. wholesale trade turnover, deflated by services producer prices, seasonally adjusted.


US Fed minutes hawkish but hike conditions not yet in place
The Federal Open Market Committee (FOMC) is unlikely to raise interest rates on 15 June even though minutes of its April meeting show that “most” participants (including non-voting members) were inclined towards such a move.
If the Committee had embraced a June increase as a central scenario, it is likely that the April policy statement would have referred to possible action “at the next meeting”, as did the October 2015 statement preceding the December rate hike.
The majority inclined towards a June move, moreover, required evidence of “economic growth picking up in the second quarter, labor market conditions continuing to strengthen, and inflation making progress toward the Committee's 2 percent objective”. Recent news is unlikely to have provided sufficient reassurance on these issues.
GDP growth should recover this quarter from just 0.5% annualised in the first quarter (below the Fed staff’s estimate) but may remain below par. The New York Fed’s “nowcasting” model is currently predicting growth of only 1.2%. The Atlanta Fed’s model is more optimistic, at 2.5%.
The April employment report released in early May, meanwhile, was slightly disappointing, with monthly payrolls growth slowing to 160,000 from a first-quarter average of 200,000, and the unemployment rate staying at 5.0%, up from 4.9% in January / February.
Annual consumer price inflation rose to 1.1% in April but the core rate excluding food and energy eased to 2.1% from 2.2% in March and 2.3% in February. The Fed prefers the personal consumption expenditures (PCE) price index as a gauge of inflation. Core PCE inflation was 1.6% in March; a June FOMC hike will be very unlikely if the April reading due on 31 May mirrors the decline in core CPI inflation – see chart.
The expectation here, based on the normal lag between narrow money and the economy, is that GDP growth will remain soft in the second quarter but rise significantly during the second half. Recent economic weakness may subdue labour market trends near term. Such a scenario could be consistent with a rate increase in September. There is a case for the FOMC to act preemptively but it is usually reactive (and too late).
UK inflation firming, NLW curbing labour demand
UK consumer price inflation fell in April because of Easter timing effects but the trend in both headline and “core” rates remains up.
Easter fell in March this year versus April in 2015. Some prices (e.g. air fares) rise around Easter so this timing difference boosted annual inflation in March this year, with a corresponding undershoot in April. The best guide to the trend is an average of the two months – 0.4% for headline CPI inflation and 1.4% for the “core” rate excluding energy, food, alcohol and tobacco. These numbers compare with lows of -0.1% and 0.8% in September and June 2015 respectively.
In addition to the Easter effect, April inflation was depressed by a fall in social housing rents, which reflects the decision announced in the summer 2015 Budget to reduce such rents by 1% per annum over the next four years. The annual rise in total rents fell from 2.9% in March to 1.9% in April, subtracting 0.1 of a percentage point from headline and core inflation.
The CPI understates current inflation because it omits owner-occupiers’ housing costs. The CPIH index includes such costs measured using the “rental equivalence” approach – they are estimated to have risen by an annual 2.2% in April. Core CPIH inflation averaged 1.5% in March / April – see first chart.
The retail prices index (RPI) uses a different approach to measuring owner-occupiers’ costs, incorporating house prices via a depreciation component. Core RPI inflation (i.e. excluding mortgage interest costs as well as energy, food, alcohol and tobacco) was 3.0% in March / April, up from a low of 2.4% in April 2015 – first chart. The core RPI rate, that is, is above the former (pre-2003) 2.5% target for RPIX inflation.
Labour market data, meanwhile, confirm some moderation of demand for workers in early 2016 but this may reflect the introduction of the national living wage rather than an economic slowdown, whether due to Breferendum uncertainty or other factors. The number of employees has stabilised since end-2015, while the stock of unfilled vacancies has fallen slightly – second chart. A breakdown of vacancies by size of firm, however, shows that most of the decline has occurred in businesses employing fewer than 10 people; vacancies have been stable among employers of 250 plus. This is suggestive of a living wage effect – smaller firms may be less able to absorb higher wage costs, while a generalised economic slowdown would be expected to reduce labour demand across all firm sizes.
Global narrow money hinting at late 2016 growth surprise
Investors’ default position is to be downbeat about prospects for global economic growth, following the serial disappointments of recent years. Global narrow money trends suggest a significant risk of an upside surprise in the second half of 2016.
Narrow money – currency in circulation plus demand deposits and close substitutes – tends to lead the economy because the demand to hold it is influenced importantly by spending intentions. Global real (i.e. inflation-adjusted) narrow money contracted before the 2008-09 recession and rebounded strongly before the subsequent recovery. It has also signalled milder economic fluctuations in recent years; a sharp fall in real money growth in 2011, for example, foreshadowed an economic slowdown in 2012.
Six-month growth of global (i.e. G7 plus emerging E7) real narrow money fell over spring / summer 2015, bottoming in August before rebounding later in the year. Allowing for a typical nine-month lead, this suggested that “global economic momentum will remain soft in early 2016 but rise in the spring / summer”, to quote from a post here at end-December.
The narrow money pick-up has gathered pace in early 2016. April data covering 60% of the global aggregate suggest that six-month growth of real money rose to more than 5%, or over 10% annualised, which would be the fastest since 2009 – see first chart.

As discussed in a post last week, the monetary signal of an upturn in economic growth in spring / summer 2016 has received support from a non-monetary leading indicator calculated from the OECD’s country composite leading indicators – first chart.
The further rise in global real narrow money growth in April has been driven by sharp increases in the US and Japan – second chart. The US pick-up was discussed previously and suggests that economic growth will rebound solidly by late 2016.

Japanese narrow money has surged since the Bank of Japan cut the marginal interest rate on bank reserves to -0.1% on 29 January. Part of this increase may reflect a portfolio reallocation in response to negative rates that has no implication for future spending. The surge, however, mirrors a sharp rise in Eurozone narrow money immediately after the ECB cut the deposit rate to negative in June 2014; this rise correctly signalled an improving economic outlook.
Narrow money is now giving a positive signal in all the major economies. As the second chart shows, the six-month change in real narrow money has been weak or negative in at least one economy for most of the past five years: the UK / Eurozone over 2010-12, Japan / China in 2014 and the US in 2015. Simultaneous solid real narrow money growth last occurred in late 2012 / 2013 and was followed by stronger global economic expansion and a significant rise in government bond yields.

