Entries from April 24, 2016 - April 30, 2016
Eurozone defies pessimists, US prospects improving slowly
Narrow money trends last summer signalled that the US economy would be weak in late 2015 / early 2016 while the Eurozone and UK would grow solidly. The latest GDP numbers are consistent with this forecast. Monetary trends continue to give a positive message for Eurozone / UK economic prospects and suggest that US growth will revive during the second half.
The quarterly rise in GDP in the first quarter was 0.6% in the Eurozone, 0.4% in the UK (0.44% excluding oil and gas extraction) and only 0.1% in the US. Over the fourth and first quarters combined, GDP grew by 0.9% in the Eurozone, 1.0% in the UK (1.1% ex oil and gas) and 0.5% in the US.
The first chart shows six-month growth rates of real (i.e. inflation-adjusted) narrow money. Growth in the US was well below that in the Eurozone and UK between June 2015 and March 2016. Weekly US data indicate a marked improvement in April – the final US data point in the chart is an April estimate. Assuming that this pick-up is confirmed, the suggestion is that US GDP growth will catch up with European performance.
Hopes of a significant US bounce-back in the second quarter, however, may be disappointed. US six-month real narrow money growth bottomed in October and monetary trends typically lead economic activity by about nine months. Real money growth, moreover, remained weak until recently.
An additional near-term concern is that US firms have made less progress with inventory adjustment than expected. Stockbuilding has fallen for three successive quarters but still amounted to 0.4% of GDP in the first quarter. With spending on goods contracting last quarter, the ratio of real inventories to final demand for goods and structures rose further – second chart. The stocks cycle, therefore, is likely to remain a drag on growth into the summer, at least.
The Eurozone and UK released money and credit data for March this week. Trends remain solid in both cases. In the UK, annual growth of narrow money, as measured by non-financial M1*, was 8.3% in March, up from 7.5% a year ago. Growth of the broader non-financial M4 measure rose further to 6.3%, the fastest since June 2008. The Bank of England’s preferred broad measure, M4ex, expanded by a smaller 4.8% in the latest 12 months but has been depressed by a fall in financial sector deposits, which are of less relevance for assessing near-term economic prospects – third chart.
Annual growth of private sector credit, as measured by M4ex lending, surged to 5.2% in March, the fastest since March 2009. A near-term setback is possible, with recent credit expansion boosted by unusually high borrowing by fund managers and a bringing-forward of buy-to-let and second home purchases to avoid the recent stamp duty rise.
The juxtaposition of consensus gloom about UK economic prospects with strengthening monetary trends is reminiscent of late 2012 / early 2013, ahead of surprisingly robust GDP expansion.
Annual growth of non-financial M1 in the Eurozone remains higher than in the UK, at 9.8% in March, while broad money growth is similar and credit expansion weaker – fourth chart. The ECB bank lending survey, however, continues to show a large majority of banks expecting stronger credit demand, suggesting a further recovery in loan growth – fifth chart.

*Non-financial = held by households and non-financial corporations.
UK economy solid, money signal positive
UK slowdown talk is overblown. GDP rose by 0.4% in the first quarter, down from 0.6% in the fourth quarter of 2015, according to the Office for National Statistics preliminary estimate. Excluding oil and gas extraction, however, the increase was 0.44%. The average revision to the preliminary growth estimate since 2005, meanwhile, has been +0.07 percentage points. Adjusting for this bias suggests that the onshore economy grew by a respectable 0.5% last quarter.
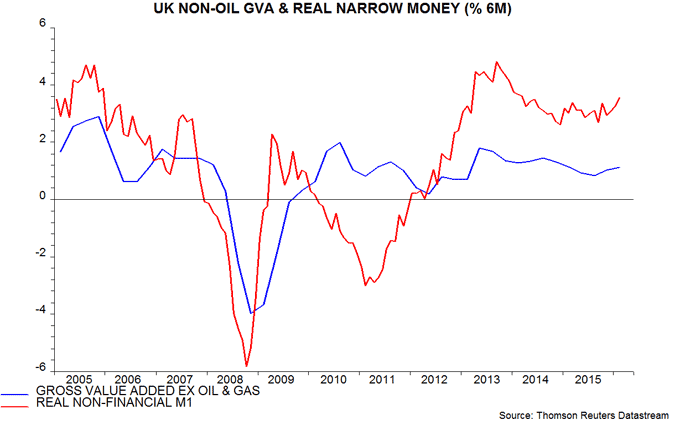
The preference here is to monitor growth in economic statistics over two quarters / six months, on the view that this improves the signal to noise ratio relative to shorter-term comparisons. Two-quarter growth of gross value added excluding oil and gas rose from 0.8% in the third quarter of 2015 to 1.0% in the fourth quarter and 1.1% in the first quarter, according to current data. The onshore economy, in other words, has gained momentum. This pick-up is consistent with a rising trend in six-month real narrow money growth since late 2014 – see first chart. (March monetary statistics will be released on Friday.)

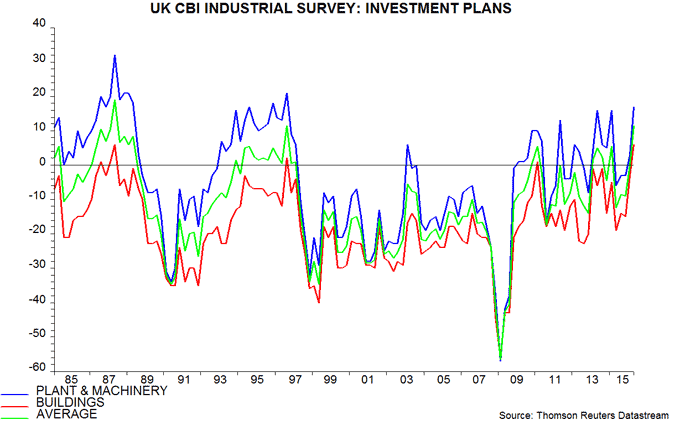
No demand breakdown of GDP is yet available for the first quarter so it is not possible to evaluate the Bremain camp claim that referendum-related uncertainty is depressing business investment. This claim, however, is contradicted by the April CBI quarterly industrial trends survey released earlier this week: an average of the net percentages of firms planning to increase spending on plant / machinery and buildings rose to its highest level since 1997 – second chart.

Chinese money trends cooling but still positive
Recent better Chinese economic data, and an associated rebound in China investment plays, were signalled by a pick-up in monetary growth in the second half of 2015. Pessimists, however, argue that economic recovery is based on unsustainable policies and will fizzle in the second half of 2016. Monetary trends have cooled since the start of 2016 but would need to weaken significantly further to support the pessimistic case.
The first chart shows six-month growth rates of industrial output and narrow money deflated by consumer prices. The narrow money measure used is “true” M1, comprising currency in circulation and demand / temporary deposits of households and non-financial enterprises. This is superior conceptually and in terms of historical forecasting performance to the official M1 measure, which excludes household deposits. Such deposits, clearly, are relevant for assessing consumer spending prospects.
Real narrow money contracted in late 2014, warning of economic weakness in 2015. Growth resumed early last year and surged from the summer. It peaked in January 2016, falling back in March to its lowest since August.
This turnaround is confirmed by broader aggregates. The preferred broad measure here is M2 excluding financial deposits, which are less likely to have signalling value about economic prospects. Such deposits grew strongly in 2014-15, inflating the headline M2 measure, but have slowed recently. Six-month growth of real M2 excluding financial deposits also fell notably in February / March – second chart.
The reversal in real money growth follows a period of significant strength and is judged here to be insufficient in terms of magnitude and duration to warrant shifting back to a negative view of economic prospects.
Monetary trends typically lead economic activity by about nine months. Even if the January real money growth peak is confirmed, the suggestion is that economic momentum will continue to rise into October 2016.
The March level of six-month real narrow money growth, moreover, remains robust by historical standards, at more than 7%, or 15% at an annualised rate. The slowdown to date, in other words, is consistent with a moderation of economic expansion, not weakness.
A further point is that the fall in real narrow and broad money growth partly reflects a sharp rise in six-month consumer price inflation, due to stronger food prices. A recovery, therefore, is possible as the food price effect fades or reverses.
Finally, pessimists may be neglecting additional economic stimulus from recent exchange rate depreciation. The China Foreign Exchange Trade System (CFETS) RMB index against a basket of trade-partner currencies has fallen by 8% from a peak in August 2015, equivalent to an annualised rate of decline of 11% – third chart. The pessimists, ironically, were correct to expect the authorities to engineer a weaker currency but underestimated their ability to achieve this, with the Fed’s help, without negative financial / economic consequences.


