
Entries from March 27, 2016 - April 2, 2016
US labour market starting to cool
 Simon Ward
 Post a Comment
US non-farm payrolls rose by a solid 215,000, or 0.15%, in March but gains seem likely to slow in the second quarter, supporting Fed Chair Yellen’s caution about raising rates.
Recent divergence of GDP and employment trends is unsustainable. GDP growth is on course to average about 1% annualised in the fourth and first quarters combined, based on the latest official fourth-quarter estimate of 1.4% and the Atlanta Fed’s “nowcast” of 0.7% expansion in the first quarter. Payrolls, meanwhile, rose by 2.1% annualised in the six months to March.
Faster growth of jobs than output implies upward pressure on unit labour costs and downward pressure on profits. It is unsustainable because lower profits cause firms to reduce hiring and increase lay-offs.
While payrolls rose respectably in March, other features of the labour market report suggest cooling. Average weekly hours failed to recover from a fall in February and are down on a year ago. Temporary help jobs usually lead aggregate payrolls and were stagnant in March after sizeable falls in January and February – see first chart.
The notion that firms are scaling back hiring is also supported by a recent decline in the Conference Board’s online help-wanted indices – second chart.
Will a weaker labour market feed back into even slower GDP growth, or even a recession? Monetary trends are giving a reassuring message. Six-month growth of real narrow money fell sharply into October 2015, warning of recent economic softness, but recovered at year-end and appears to have risen to a 10-month high in March, based on available weekly data – third chart. The suggestion is that GDP momentum will revive from around mid-year, in which case any near-term labour market weakening is likely to prove temporary.
Chinese economic news improving, money signal still positive
Chinese economic growth is reviving, as predicted by stronger monetary expansion last autumn (see, for example, here). The latest monetary data suggest that the recovery will extend through late summer, at least.
March purchasing managers’ survey results beat consensus estimates, with forward-looking components notably stronger. The new orders indices in the official and Markit / Caixin manufacturing surveys rose above 50, to their highest levels since September 2014 and February 2015 respectively – see first chart. A pick-up had been suggested by a sharp rise in the business expectations component of the official survey in February; this component strengthened further in March – second chart.

The new orders component of the official non-manufacturing survey also regained the 50 level last month, having fallen below it in January / February.
Not all business surveys are yet giving a positive message. The PBoC’s quarterly survey of entrepreneurs, also released today, reported a further weakening of domestic and export orders. This survey, however, seems to lag at turning points: for example, the official and Markit / Caixin manufacturing PMI new orders indices bottomed in November 2008 but the trough in the PBoC survey orders components occurred in the first quarter of 2009.
Other recent indicators support the view that reflation is underway. Annual new house price inflation rose further to 3.6% in February, while industrial profits in January / February were up by 4.8% from a year before. The improvement in these series is consistent with the normal pattern following money supply acceleration – third chart.
Foreign exchange reserves data for March next week could provide further good news, showing a slowdown in the rate of decline or even a small rise. The monthly reserves change has been positively correlated with the premium / discount of the offshore renminbi (CNH) to the onshore rate (CNY); a premium has recently been restored, following a large discount in January – fourth chart. Valuation effects should boost the US dollar value of reserves, with the US currency weakening against the euro, sterling and yen during March.
The PBoC has taken advantage of dollar weakness to pursue further depreciation against the new currency basket. The RMB index is down by 2.9% since the start of the year and 7.2% below its level before the August mini-devaluation – fifth chart. This has contributed to a recovery in the PMI export order indices, although global activity, in addition, may be firming.
UK economy defying consensus gloom
UK GDP and monetary data released today support the upbeat view here of current and prospective economic performance – see previous post.
GDP is now estimated to have risen by 0.6% between the third and fourth quarters of 2015, up from 0.5% previously. The upgrade was due to the services sector, where output increased by a bumper 0.8% – the strongest quarterly gain since the fourth quarter of 2015.
Strong services momentum has carried over into the first quarter, as suggested by January turnover data discussed in the earlier post. Services output rose by a monthly 0.2% in January to stand 0.5% above the fourth-quarter level. Also taking into account industrial and construction output data, GDP in January was an estimated 0.4% higher than in the fourth quarter – see first chart. Growth for the first quarter as a whole, therefore, is on course to match or beat the 0.6% fourth-quarter gain.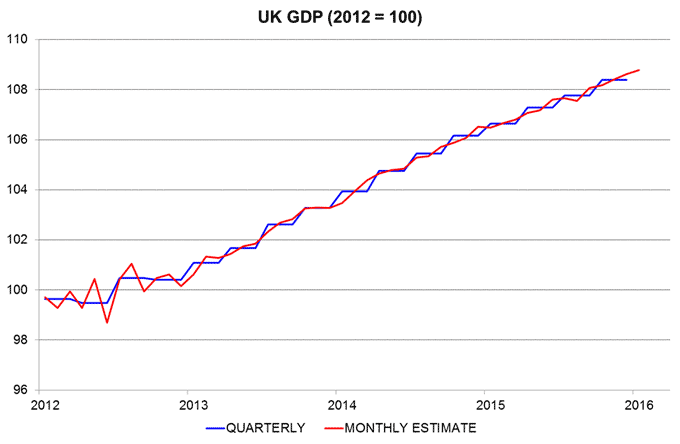
Recent stronger economic performance was foreshadowed by a pick-up in money and credit growth during 2015. This pick-up has extended in early 2016. The preferred narrow and broad aggregates here are non-financial M1 and M4, covering money holdings of households and private non-financial corporations (PNFCs)*. Annual growth of non-financial M1 was 8.2% in February, a 15-month high. Annual non-financial M4 growth rose to 5.9%, the fastest since June 2008 – second chart.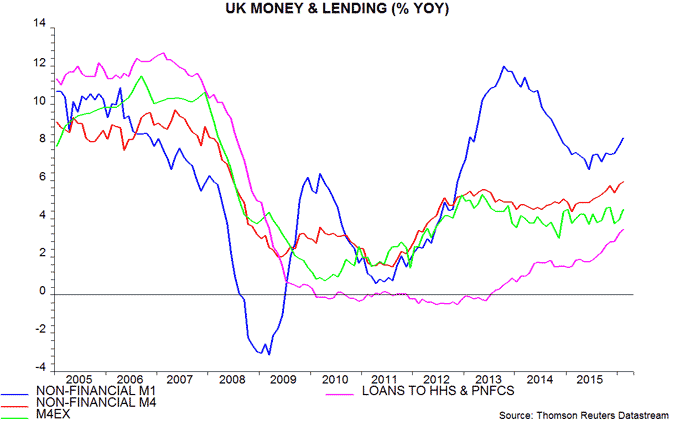
The Bank of England’s favoured broad aggregate, M4ex, is growing more slowly – an annual 4.5% in February. This reflects its inclusion of money holdings of non-bank financial institutions (excluding intermediaries), which fell by 4.1% in the latest 12 months. Such holdings are less relevant for judging near-term spending prospects.
Credit trends, meanwhile, continue to strengthen, with annual growth of bank lending to households and PNFCs up to 3.4% in February, the fastest since March 2009 – second chart. Total bank credit to the private sector (i.e. M4ex lending, including credit extended to non-bank financial institutions) rose by 4.8% in the latest 12 months.
The “best” monetary forecasting indicator, in terms of reliability in signalling GDP turning points over the last 50 plus years, is real (i.e. inflation-adjusted) non-financial M1. Six-month growth of this measure fell between September 2013 and November 2014 ahead of a moderation in two-quarter GDP expansion between the third quarter of 2014 and the second quarter of 2015 – third chart. Real money growth, however, has risen since September 2015 and the GDP / output data discussed above suggest that the economy is already responding, with stronger momentum likely to extend into the summer, at least.
The gloomy consensus forecast of GDP growth of only 2.0% in 2016 seems to assume that Brexit uncertainty will weigh on spending, even if the June referendum delivers a remain result. Any such drag, however, has arguably been more than offset by the MPC delaying further a rise in interest rates and associated exchange rate weakness.
In other news today, the current account deficit widened to £32.7 billion, or a record 7.0% of GDP, in the fourth quarter of 2015. The shortfall, however, was more than offset by a valuation gain on existing stocks of assets and liabilities: the net international investment position (NIIP) improved from -£185.5 billion to -£65.9 billion over the quarter. The NIIP has risen by £60.8 billion over the last five years despite a cumulative current account deficit of £311.3 billion.
*M1 = notes / coin plus sight deposits. M4 = M1 plus other sterling deposits, repos and short-maturity bank paper.
Eurozone money trends stable / solid
Eurozone money and credit trends continue to give a positive signal for economic prospects. GDP and domestic demand rose by 1.6% and 2.2% respectively in the year to the fourth quarter of 2015 and may grow at similar rates during 2016 (i.e. well above “potential” economic expansion estimated by the EU Commission, IMF and OECD at 1.0-1.2% in 2016).
The “best” monetary measure for economic forecasting, according to ECB research, is real (i.e. inflation-adjusted*) non-financial M1, comprising currency holdings and overnight deposits of households and non-financial corporations. This contracted before the 2008 and 2011 recessions, rebounding strongly before the 2009 and 2013 recoveries. Six-month growth of this measure rose to 5.0% in February, or 10.3% annualised. Growth has been rangebound at a high level since early 2015, consistent with stable, solid economic expansion – see first chart.
There is no country breakdown of non-financial M1 but the ECB publishes country data on total overnight deposits (i.e. including those of financial corporations). The six-month change in real overnight deposits is strong in Spain and France, and solid in Italy and Germany – second chart. In other countries (not shown), it is particularly strong in Portugal and weak only in the Netherlands, reflecting a fall in cash pooling deposits, which may have little economic significance.
Broad money M3 rose by an annual 5.0% in nominal terms in February, unchanged from January. This is above the ECB’s 4.5% “reference value” deemed to be consistent with its inflation target and strong in real terms relative to a 12-month change in consumer prices of -0.2% in February.
Annual M3 growth, however, is below a peak of 5.4% in April 2015, just after the ECB launched QE. This mirrors experience in the US, UK and Japan, where QE also seemed to have little broad money impact. As discussed in previous posts, QE was ineffectual in monetary terms because it was associated with 1) increased selling or reduced buying of government securities by commercial banks and / or 2) a deterioration in the basic balance of payments position and a consequent fall in the banking system’s net external assets.
The latter has been the dominant factor in the Eurozone to date. As the third chart shows, an increased contribution to annual M3 growth of banking system lending to general government since QE was launched has been matched by the contribution of banks’ net external assets shifting from positive to negative.
*Consumer prices used for adjustment here.


