Entries from January 17, 2016 - January 23, 2016
UK inflation: reasons for concern
Posts here in 2013 suggested that the trend in UK core and headline consumer price inflation would change from down to up in early 2014 in lagged response to faster monetary growth and labour market tightening. The core rate did pick up into mid-2014 but then reversed course sharply, falling to a new low in the first half of 2015. Headline inflation bottomed at -0.1%. What went wrong?
The forecast was invalidated by two major developments: the effective exchange rate surged by 15% between 2013 (calendar year average) and August 2015, putting strong downward pressure on manufactured import prices; and plunges in crude oil and natural gas prices from June and November 2014 respectively cut household energy bills and reduced costs for suppliers of core goods and services.
A case, nonetheless, can be made that domestically-generated inflation has followed the expected path. The annual rate of change of unit labour costs, in particular, rose from -2.0% in the second quarter of 2014 to 2.0% in the third quarter of 2015 – see first chart. It may have remained at around this level in the fourth quarter, with recent slower pay growth offset by weaker productivity performance.
The disinflationary impact of the strengthening exchange rate, meanwhile, has probably peaked. The average level of the effective rate in January is still slightly higher than in January 2015 but it has fallen by 5% since August.
Core consumer price inflation, therefore, has started to recover. The annual change in the CPI excluding energy, food, alcohol and tobacco rose from a low of 0.8% in June 2015 to 1.4% in December. A narrower core measure also excluding education (to avoid a distortion from the large rise in undergraduate tuition fees from 2012) has increased more sharply, from 0.5% to 1.3% – second chart.
The argument that core inflation would rise was based on historical lagged relationships with monetary growth and measures of labour market slack. The labour market has tightened significantly further since the first half of 2014. The unemployment rate has fallen from 6.5% then to 5.1% in the three months to November, with the November single-month estimate at 4.9%. The stock of unfilled vacancies has risen by 18% since the first half of 2014, while the recruitment difficulties index in the December Bank of England’s agents’ survey reached its highest level in data extending back to 2005.
Broad money trends have also strengthened. The preferred broad measure here under normal circumstances is non-financial M4, comprising money holdings of households and private non-financial corporations. Annual growth of this measure, however, is currently understated because of households switching funds from bank deposits into the Osborne election bonds made available to pensioners by National Savings for a brief period in early 2015 – such bonds would be included in M4 if issued by a bank instead of the government. A wider aggregate including all National Savings products grew by an annual 6.6% in November, the fastest since May 2008 – third chart.
Strengthening credit growth suggests continued solid broad money expansion. The M4Lex lending measure (i.e. bank lending to the private sector excluding “intermediate other financial corporations”) rose by an annual 3.5% in November, the fastest since April 2009. The stock of arranged but undrawn sterling credit facilities, meanwhile, has surged, a development that normally signals stronger lending expansion – fourth chart.
The tentative view here, therefore, is that the recent increase in core inflation, unlike the 2014 firming, will be sustained (with due allowance for monthly volatility). Domestic arguments for a rise are stronger now than in early 2014, while the exchange rate drag is likely to lessen, with possible downward pressure on sterling from Brexit uncertainty.
If correct, Bank of England Governor Mark Carney was unwise to validate expectations of a further extended interest rate hold in a speech this week. This signal threatens to accelerate the pick-up in credit growth and sustain broad money expansion at a level likely to be too high to be consistent with 2% inflation over the medium term.
Market woes due to US / credit tightening not China
Current market weakness, on the judgement here, reflects two main factors: US economic growth has fallen to stall speed, as predicted by a sharp slowdown in real narrow money during 2015; and a further plunge in the oil price has raised energy-related default risk and led to a generalised tightening of credit conditions.
Markets are fearful that tighter credit will tip the US and global economies over into a recession.
The consensus view that market weakness is being driven by events in China and other emerging economies is not shared here. Chinese economic woes are well discounted and recent news is consistent with improving conditions – see below.
Monday’s post argued that a US recession is still not the most likely scenario, based on current evidence. Real narrow money, in particular, did not contract during 2015 and recovered some momentum at year-end. US recession risk, however, is greater now than during scares in 2011 and 2012.
Important upcoming indicators for assessing the likely extent of US economic weakness include:
-
January ISM manufacturing new orders (1 February). A fall in the orders index below 42.5 (49.2 in December) would support a recession scenario. The Philadelphia Fed manufacturing survey (tomorrow) often provides an early guide to the ISM: a drop in the current new orders balance below -15 would be consistent with a sub-42.5 ISM reading.
-
January Conference Board consumer expectations (26 January). Expectations usually fall sharply at the onset of recessions. The Michigan survey expectations component, however, rose in early January.
-
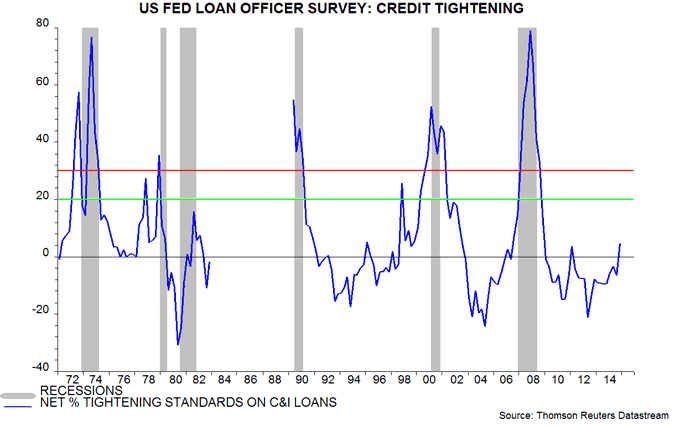
Credit tightening balances for commercial and industrial loans in the Fed’s January senior loan officer survey (early February). A rise in the average of the balances for large / medium and small firms above 20 would be worrying, while a move above 30 would strongly suggest an oncoming recession – see first chart.

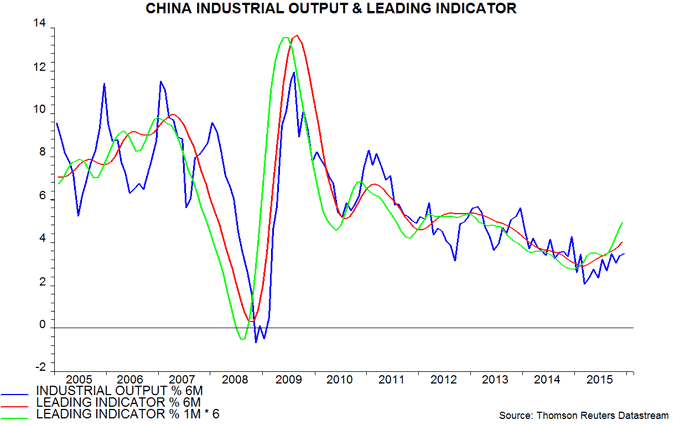
Chinese economic news yesterday slightly disappointed consensus expectations but is nonetheless consistent with an ongoing gradual recovery in momentum. The preferred growth indicator here is the six-month change in industrial output, which matched its September high in December and is well above its March low. The recent firming is in line with the message from the OECD’s leading indicator – second chart*.
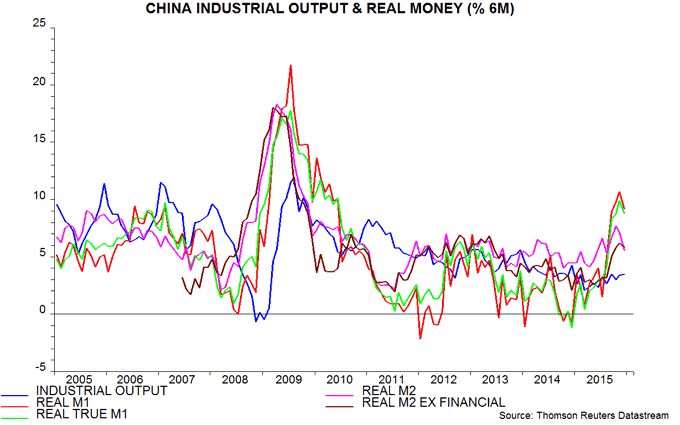
Money / credit trends continue to suggest a more significant recovery in the first half of 2016. The best narrow and broad money measures for forecasting purposes are “true” M1 and M2 excluding financial deposits: true M1, unlike the official M1 aggregate, includes household demand deposits, while financial deposits grew unusually rapidly in 2014-15, causing M2 to overstate economic prospects. Six-month growth of both preferred measures, deflated by consumer prices, has risen sharply since mid-2015, suggesting a stronger economy by the end of the first quarter, based on a typical nine-month lead – third chart.
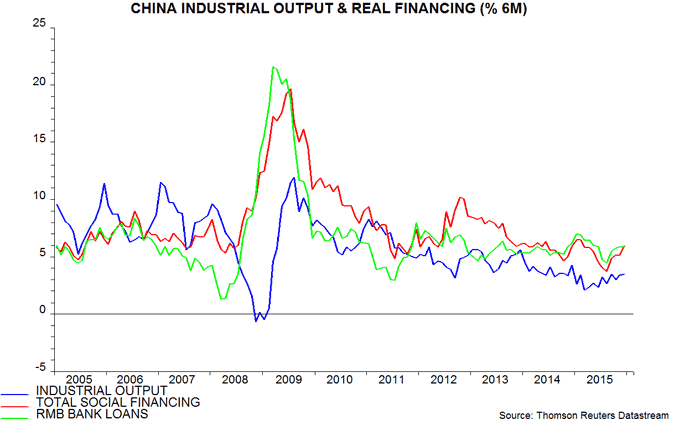
Credit trends are similarly hopeful, with six-month growth of real total social financing (TSF) and RMB bank loans rebounding since mid-2015 – fourth chart. One caveat is that the TSF numbers do not take account of repayments of overseas debt by Chinese corporations. These, however, are unlikely to have been large enough to offset the pick-up in onshore credit: according to official data on gross external debt, Chinese entities, excluding general government and banks, reduced their liabilities by $35 billion during the third quarter, equivalent to 0.2% of the stock of TSF.
*Based on the World Bank’s seasonally-adjusted industrial output series, updated for November / December by applying official year-on-year growth data to year-earlier levels.
Is the US entering a recession?
A post in August 2014 suggested that the US economy would be at risk of a recession in 2016-17, reflecting scheduled downturns in the Kitchin stockbuilding cycle and the Juglar business investment cycle. This possibility argued for the Federal Reserve raising interest rates sooner rather than later*.
The concern here about possible US economic weakness in 2016 was magnified by a slowdown in real narrow money from spring 2015, discussed in a post in October. In addition, the ratio of inventories to sales had moved above its long-run falling trend in early 2015, consistent with the scheduled peaking of the stockbuilding cycle.
Recent US economic news has been weaker than expected – the Citigroup surprise index has been in negative territory since November, with its current level close to a seven-month low. While consensus economic forecasts remain upbeat, markets are increasingly fearful that another recession is at hand.
Recent developments suggesting heightened recession risk include:
1) Fourth-quarter GDP growth is tracking at just 0.6% at an annualised rate, according to the Atlanta Fed. The tracking estimate, moreover, is on a falling trend, implying that it could turn negative as additional information is incorporated.
2) The ratio of business inventories to sales remained at its highest level since 2009 in November – see first chart. Firms have started to cut stock levels but may accelerate the process in early 2016, implying another weak or negative GDP print in the first quarter.
3) Industrial output has fallen in 10 out of the last 12 months. As John Hussman notes, this has never been observed except in the context of a recession.
4) The ISM manufacturing new orders index fell below 42.5 in the last six recessions. It stood at 49.2 in December but the equivalent index in the January New York Fed manufacturing survey was 38.2 – second chart.
These developments are worrying but a recession is not viewed here as the most likely scenario, for the following reasons:
a) Real narrow money contracted before 10 of the last 11 recessions. The six-month rate of change fell to zero in October but recovered modestly in November / December – third chart. 
b) Industrial output weakness has been concentrated in mining and utilities. Manufacturing output fell in eight rather than 10 of the last 12 months. The increase in the rising months, moreover, was greater than the decline during falling months – output, therefore, was 0.8% higher in December than a year before.
c) Consumer expectations fell sharply at the onset of previous recessions. The University of Michigan and Conference Board expectations measures are below their levels in early 2015 but only modestly, with the Michigan reading increasing in early January – fourth chart.
d) Manufacturers in New York state are more exposed to Canadian competition, so the latest very weak survey may partly reflect the collapse in the Canadian dollar. The Philadelphia Fed survey may be a better guide to the national picture – January results are due on Thursday.
e) The spread of corporate B-rated bonds over Treasuries surged through 700 basis points (bp) at the onset of the last three recessions – fifth chart. The current spread is 650 bp, with part of the recent rise due to a blow-out in the energy sector.
To summarise, recent developments validate the concerns here about US economic weakness but a scenario of stagnation / slow growth is more likely than a recession, based on current evidence.
*To quote from the post, ”If the Fed believes that a higher level of interest rates is necessary for medium-term inflation control reasons, there is a case for it making the adjustment by mid-2015 at the latest, while the Kitchin cycle is still in an upswing.”

