Entries from January 10, 2016 - January 16, 2016
Chinese exports better, market share still rising
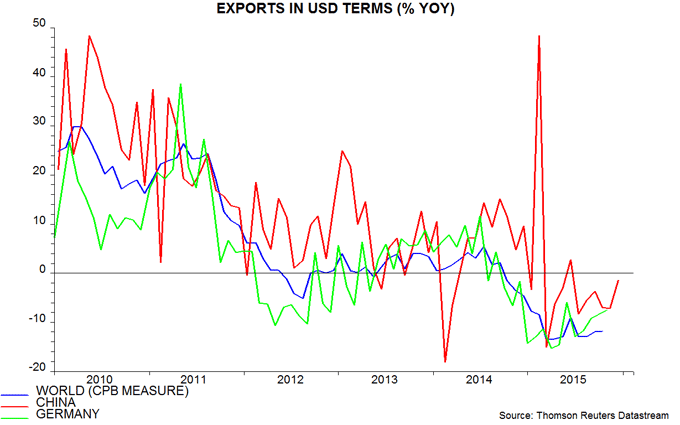
Chinese December trade flows were significantly less weak than expected, although monthly data are volatile. Exports, in particular, fell by only 1.4% in US dollar terms from a year before – the smallest annual decline since June.
The results suggest that Chinese exporters continued to gain market share at year-end, casting doubt on claims that the exchange rate was or remains overvalued. The dollar value of world trade fell by 11.9% in the year to October, according to the Dutch CPB institute, a month in which the annual decline in Chinese exports was “only” 6.9% – see chart. Few countries have yet released December data: the Chinese export result was far better than a 13.8% annual fall in Korea.
There is concern that the Chinese numbers have been distorted by fake invoicing associated with illegal capital outflows. This could partly explain stronger-than-expected imports but is unlikely to have affected the export data – overrecording of exports typically occurs when companies wish to bring capital onshore in expectation of a rising yuan, not vice versa.
In other Chinese news, auto production rose by an annual 16.0% in December following a 17.7% gain in November. This suggests that the larger contribution of the auto sector to annual industrial output growth in November will be sustained in December results next week.
A recent supposedly-bearish story was that rail freight volume fell by 10.5% in calendar 2015. If confirmed by official data, this actually suggests a slowdown in the rate of decline at year-end. More importantly, rail freight is no longer (if it ever was) a useful coincident indicator of economic activity because of structural change and a shift to road, which carries nearly 10 times as much volume. Road freight volume rose by 7.4% in the year to November, with total freight up by 5.4%. The declining share of rail implies that the widely-quoted “Li Keqiang index" – which combines changes in rail freight volume, electricity consumption and bank loans – seriously understates economic growth.

OECD's Chinese leading indicator signalling growth recovery
The OECD’s Chinese leading indicator strengthened again in November, suggesting that the consensus is too pessimistic about economic prospects.
The OECD presents its leading indicators in “ratio-to-trend” form, i.e. a rise (fall) indicates that an economy will grow above (below) its trend rate. The Chinese ratio-to-trend indicator increased for a second month in November, having declined steadily over the two years to August. According to the OECD, the latest results “confirm the tentative signs of stabilisation flagged in last month’s assessment”.
While the ratio-to-trend presentation is preferred, the OECD also calculates a leading indicator of the level of Chinese industrial output. The chart compares six-month and rescaled one-month changes in this indicator with the six-month change in output. The six-month indicator change has been firming since February 2015, while the one-month rise in November was the largest since February 2013.
The leading indicator comprises six components: production of chemical fertilizer, crude steel, buildings and motor vehicles, overseas orders from the PBoC’s quarterly survey of industrial enterprises and Shanghai stock exchange turnover value. Since the components are non-monetary, the positive signal is independent of recent better money / credit trends.
An important caveat is that the OECD revises its leading indicators monthly, sometimes significantly. It would be surprising, however, if future changes revised away the recent reversal of direction.


