Entries from December 27, 2015 - January 2, 2016
Global economic / monetary trends at end-2015
Annual GDP growth in the G7 economies and seven large emerging economies (the "E7") fell to 2.4% in the third quarter of 2015, the lowest since the second quarter of 2013*. GDP and industrial output fluctuations are closely correlated. Annual industrial output growth continued to weaken through November, suggesting a further decline in GDP expansion in the fourth quarter – see first chart.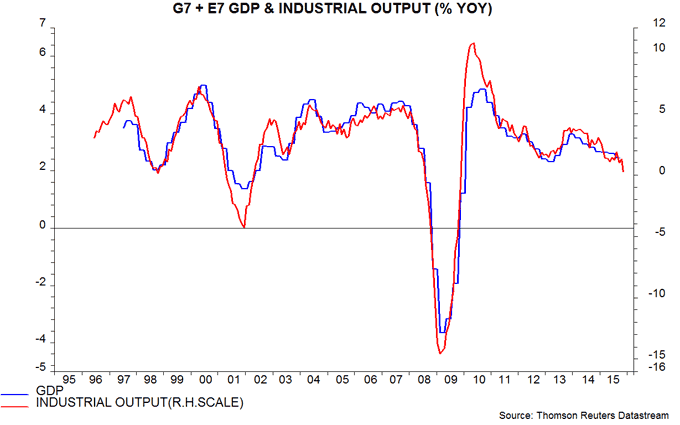
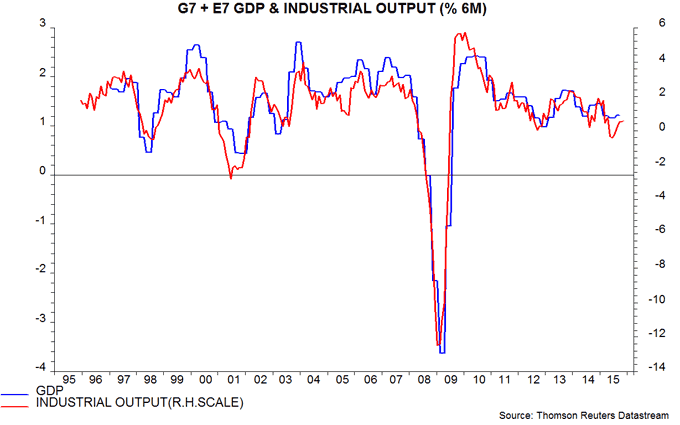
Still-softening annual growth, however, conceals a recovery in shorter-term momentum. The six-month change in industrial output has moved up significantly from a low reached in June, though remains weak. Six-month (or two-quarter) GDP growth may also have bottomed in the second quarter – second chart.
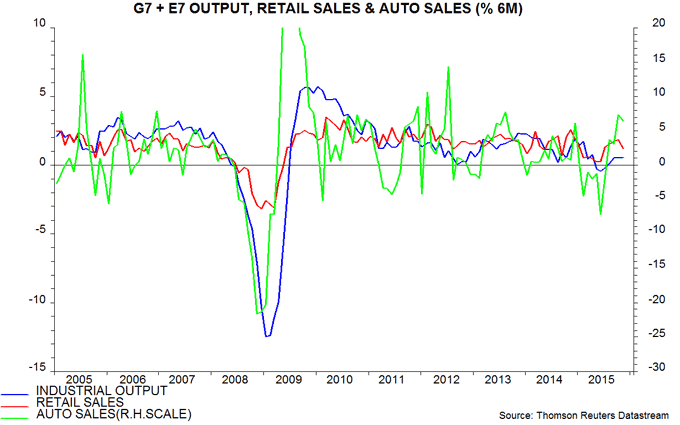
This revival has been driven by stronger consumer demand as households have become more convinced that lower energy bills are permanent, implying that the saving can be spent on other items. Six-month retail sales growth has rebounded since the spring while auto sales have surged, with strength magnified by a recent sales tax cut in China – third chart.
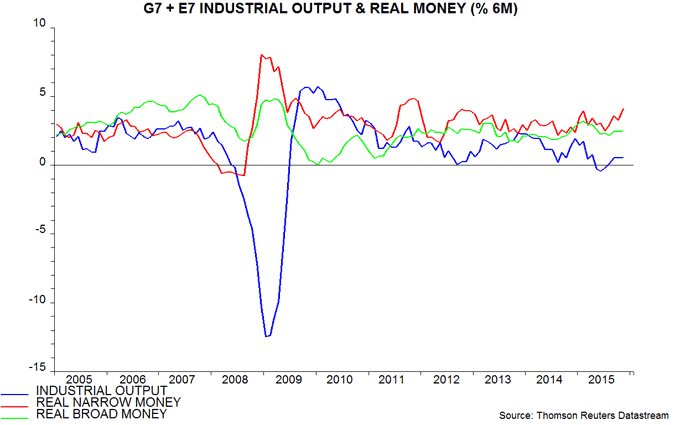
Real money trends, meanwhile, were respectable during 2015 and firmed towards year-end. Six-month growth of G7 plus E7 real narrow money bottomed in July, returning to the top of its range in recent years by November. Allowing for a typical nine-month lead, this suggests that global economic momentum will remain soft in early 2016 but rise in the spring / summer – fourth chart.
The rise in aggregate real money expansion, however, conceals a significant divergence between the G7 and E7. Six-month G7 real narrow money growth fell sharply between February and October, reflecting weakness in the US and, to a lesser extent, Japan. A surge in Chinese M1, by contrast, has pushed E7 growth to its highest level since September 2010 – fifth chart.
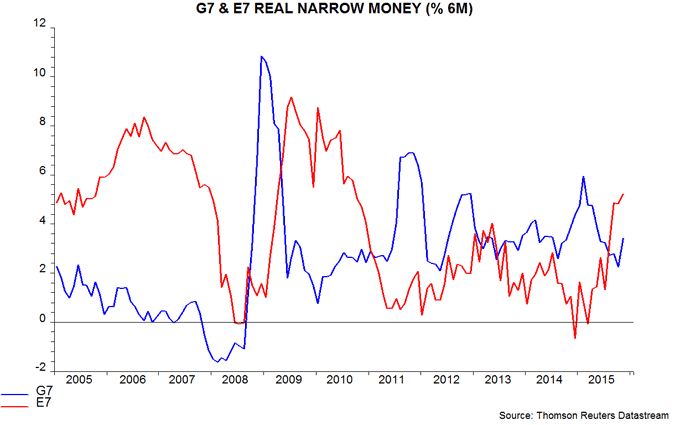
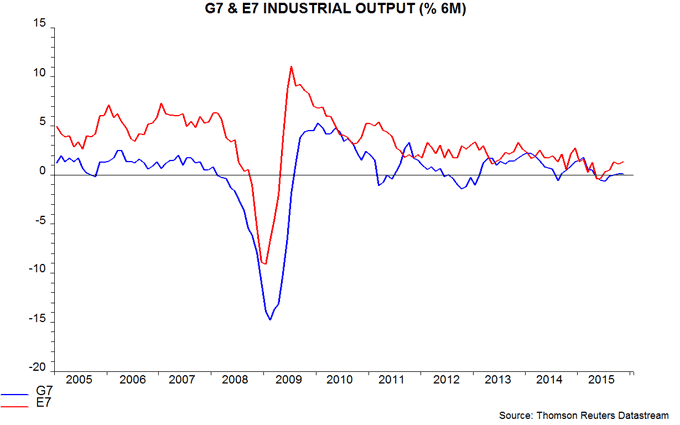
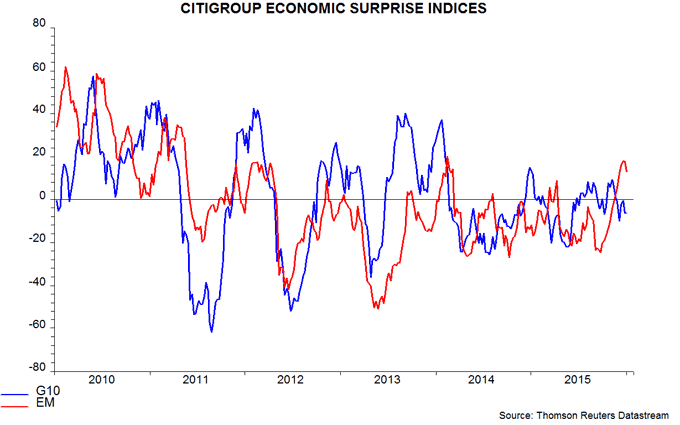
This divergence is somewhat at odds with the consensus view that the US / G7 economies will expand solidly in 2016 while emerging markets will remain a drag on global growth. The suggestion is that Chinese / E7 economic news will surprise positively by mid-2016, while US growth may disappoint (again), reducing pressure for Fed tightening. There are tentative hints of this theme in recent data: six-month industrial output momentum has recovered by more in the E7 than the G7, while economic data surprises have, on average, been positive in emerging markets and negative in the G10 developed economies, according to Citigroup – sixth and seventh charts.
A further revival in E7 output growth, as suggested by monetary trends, would offer relief to commodity markets. Industrial commodity prices are reasonably well correlated with E7 industrial activity, although supply shocks periodically distort the relationship (and did so in 2014-15). Based on history, six-month E7 industrial output growth may need to rise above 2.5%, or 5% annualised, for commodity prices to recover sustainably – eighth chart.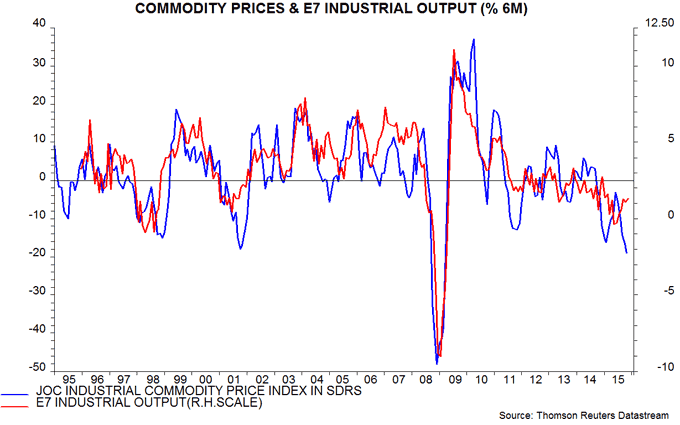
From the perspective here, the key uncertainty as 2016 begins is whether the recent Chinese narrow money surge carries the usual implication of improving economic prospects. Similar policy-driven pick-ups in 2008 and 2012 were followed by significant economic accelerations and analysis of the monetary data does not suggest any distorting factors.
*Weighted average of national data. Weights are averages of GDP shares at current market and purchasing power parity exchange rates.
Simple UK growth forecasting rule gives positive message for 2016
A simple forecasting rule-of-thumb based on the money supply and share prices – a rule that correctly predicted that economic growth would strengthen in 2013-14 but moderate in 2015 – suggests that GDP will rise by more than the consensus forecast of 2.3% in 2016*.
The forecasting rule assesses growth prospects for the coming calendar year based on whether end-year levels of real (i.e. inflation-adjusted) money supply growth and share prices are higher or lower than 12 months earlier. Real money growth is measured by the annual rate of change of the broad M4ex measure deflated by the retail prices index excluding mortgage interest (RPIX). Share prices are measured by the domestically-orientated FT 30 index, again deflated by the December RPIX.
Annual GDP growth averaged 2.3% in the 50 calendar years from 1966 to 2015. The forecasting rule gave a “double-positive” signal for 16 of these years (i.e. both real money growth and share prices at the end of the prior year were higher than 12 months before). GDP growth in these years averaged 3.9%.
There were, by contrast, 11 years for which the forecasting rule gave a “double-negative” signal. Growth in these years averaged just 0.3%. In the remaining 23 cases where the money supply and share prices gave conflicting signals, GDP expansion averaged 2.2%.
The rule has continued to work well in recent years. A double-negative warning was given at end-2008 ahead of a 4.2% GDP slump in 2009. A double-positive at end-2012, meanwhile, signalled that growth would pick up significantly in 2013: GDP rose by 2.8% in the year to the fourth quarter, with strength sustained in 2014.
The rule suggested that 2015 would be an “average” year for growth: real money growth in December 2014 was higher than a year before but real share prices were lower. The current consensus estimate is that GDP rose by 2.4% in 2015.
What is the message for 2016? The average level of the FT 30 index in December 2015 (through 29 December) was 4.3% higher than in December 2014, implying a real gain of 3.1% allowing for expected December RPIX inflation of 1.2%. (The FTSE 100 and all-share indices were lower in December than a year before but this reflects their international / commodities exposure. The FTSE 250 mid-cap index better represents the UK economy and, like the FT 30, rose during 2015.)
The annual rate of change of real M4ex, meanwhile, was 3.7% in October versus 2.7% at end-2014. M4ex growth, moreover, was depressed in 2015 by a diversion of household savings flows into National Savings, reflecting competitive interest rates. A broader liquidity measure including NS products has shown greater acceleration since end-2014.
Assuming stable real money growth in November / December, therefore, both elements of the forecasting rule will give a positive signal for 2016, suggesting GDP growth above the long-run average of 2.3% – also the current consensus projection.
How could a positive growth surprise be generated? Possible drivers include:
-
Solid consumer spending. Household consumption grew by 3.0% in the year to the third quarter of 2015, the largest annual increase since the fourth quarter of 2007. Real pay may continue to rise strongly in 2016, with faster nominal growth offsetting a recovery in inflation. The saving ratio is low but may remain depressed against a backdrop of increasing household wealth and still-falling borrowing costs: the ratio of net wealth to disposable income reached another record in 2015 while interest payments declined to 4.8% of income in the third quarter from 5.2% a year before.
-
Stronger investment. Business investment rose by an annual 5.8% in the third quarter and may accelerate further as consumption growth remains solid and the “output gap” closes. Corporate money holdings – a leading indicator – have surged, rising by 12.7% in the year to October. Infrastructure investment, meanwhile, is strengthening – new infrastructure orders in the third quarter were 63% higher than a year before – and repairs related to the end-2015 floods may also support construction activity.
-
A turnaround in the stocks cycle. A fall in stockbuilding cut GDP growth in the year to the third quarter by 0.9 percentage points, according to current official statistics (which may, however, be revised significantly). With consumer spending / business investment rising solidly, stock levels may now be better aligned with final demand, suggesting a neutral or positive growth contribution in 2016.
Fiscal tightening and weaker external trade are possible drags on growth in 2016, while uncertainty related to the Brexit referendum may delay an investment pick-up. The degree of fiscal restriction, however, is projected by the Office for Budget Responsibility to be little changed between 2015-16 and 2016-17, while net exports may be supported by a continued economic recovery in the Eurozone and recent sterling depreciation against the US dollar.
*Consensus figures from the Treasury’s monthly survey of forecasters.

