Entries from December 13, 2015 - December 19, 2015
UK pay trends no reason for rate rise deferral
The MPC is using a recent slowdown in pay growth, as measured by average weekly earnings (AWE), as the latest excuse to defer a rate hike. This is likely to prove misguided, for several reasons.
First, the fall in annual AWE growth from a peak of 3.3% over March-May to 2.4% in the three months to October probably reflects a combination of lower average weekly hours and compositional effects, rather than a change of trend. Average hourly earnings rose by an annual 3.0% in the latest three months*.
Secondly, non-wage labour costs are rising rapidly – by 6.0% in the year to the third quarter, according to the experimental “index of labour costs per hour” (ILCH), with strength partly due to increases in sickness and maternity / paternity pay. Total hourly labour costs, therefore, grew by an annual 4.0% last quarter, up from 1.8% a year before – see chart below from the ILCH release.
Thirdly, a focus on current pay ignores coming upward pressure on labour costs from the introduction of the national living wage and the “apprentice levy” payroll tax.
Fourthly, the labour market continues to tighten: the single-month unemployment rate fell to 5.1% in October versus a fourth-quarter forecast of 5.3% in the November Inflation Report, while the stock of unfilled vacancies rose to another record in the three months to November.
Finally, current pay trends need to be assessed in the context of near-zero inflation. A rebound in the latter in 2016 will ensure upward pressure on AWE growth even if the labour market stabilises or softens.
Increased labour cost growth, in other words, is likely to accompany rather than lead a pick-up in inflation. Economists learned that wages were an unsuitable intermediate policy guide in the 1970s; the current crop of central bankers seems to have forgotten the lesson.
*AWE growth of 2.4% adjusted for a 0.7% fall in average weekly hours worked reported by the Labour Force Survey.

Source: Office for National Statistics
FOMC reaction: confidence with crossed fingers
The hike is effectively 20 rather than 25 basis points because market rates will track the increase in the overnight reverse repo rate from 0.05% to 0.25%. The Committee signalled confidence in the economic outlook by voting unanimously while maintaining median forecasts of a 1 percentage point rise in rates during 2016 and a longer-run "neutral" rate of 3.5%. The doves, however, obtained an important concession in the form of a new sentence in the statement linking further action to actual progress in lifting (core) inflation, raising the bar for an early follow-up move. The reduction in near-term Fed uncertainty should allow markets to refocus on a reasonably favourable global economic backdrop, with moderate growth proceeding across the developed economies and signs of reacceleration in China.
US corporate finances better, suggesting credit relief
US corporate finances improved in the third quarter, according to the Fed’s quarterly financial accounts, holding out hope of some relief from the recent sell-off in corporate credit.
The redemption yield on the Bank of America / Merrill Lynch high yield cash pay index reached 9.1% this week, the highest since 2011, when the yield peaked at 10.1%. The index yield is inflated by distressed pricing of energy bonds but the move higher this year has been general: the non-energy yield has increased from a low of 5.9% in February to 8.3% – see first chart.
A post in June suggested that yields would come under upward pressure following a deterioration in corporate finances in early 2015. The “financing gap” of non-financial corporations – i.e. the difference between their capital spending and retained earnings – was reported by the Fed to have risen to 1.2% of GDP in the first quarter, the highest since the second quarter of 2008. Companies, moreover, had stepped up borrowing to finance share buy-backs and cash M&A transactions. Their total net borrowing requirement – defined as the financing gap plus share purchases net of issuance – had reached 4.3% of GDP. This borrowing measure has been a good leading indicator of yield spreads historically – second chart.
The financing gap, however, fell back to 0.3% of GDP in the third quarter as companies cut capital spending on stocks and non-produced assets. Net share buying last quarter, moreover, was the weakest since the third quarter of 2009. The net borrowing requirement, therefore, declined sharply from 4.1% of GDP in the second quarter to 1.0% in the third.
This reversal may support a near-term stabilisation or recovery in corporate credit but it is doubtful that yields have yet reached a major cyclical peak, for several reasons. First, the current spread of high yield bonds over Treasuries remains well below the levels at previous major highs – second chart.
Secondly, the last three peaks occurred at least a year after the net borrowing requirement topped out. Assuming that the latter reached a maximum in the second quarter, this would suggest mid-2016 as the earliest date for a major yield decline to begin.
Thirdly, the third-quarter improvement in corporate finances may prove temporary. Capital spending on stocks should decline further but earnings and retentions are at risk from rising unit labour cost growth and higher borrowing costs. The third-quarter drop in net share purchases, moreover, is likely to have reversed in the current quarter, with Trim Tabs reporting strong buy-back activity and moderate issuance.
An additional caveat is that the Fed’s statistics are subject to significant revisions and further information could lead to the reported third-quarter improvement being scaled back.


Chinese economy recovering, narrow money still surging
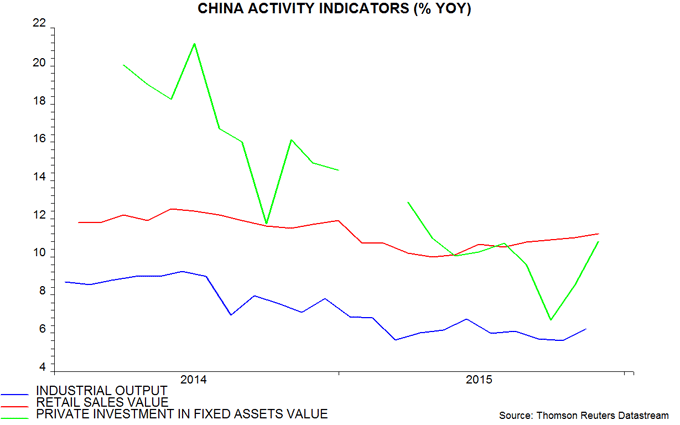
Posts since September have argued that a Chinese economic growth revival is under way and will gather strength in early 2016. November activity data are consistent with this scenario: annual growth rates of industrial output, retail sales and private fixed investment rose notably on the month, beating consensus expectations – see first chart.
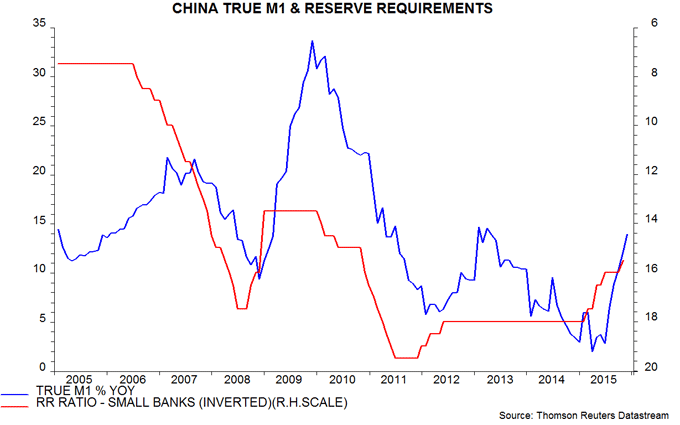
The PBoC, meanwhile, has released additional monetary detail for November, allowing calculation of the “true M1” measure followed here*. Annual growth of true M1 rose further to 13.9% last month, the fastest since March 2013. As in 2008-09 and 2012-13, growth started to pick up several months after cuts in official interest rates and reserve requirements, which began in November 2014 and February 2015 respectively – second chart.
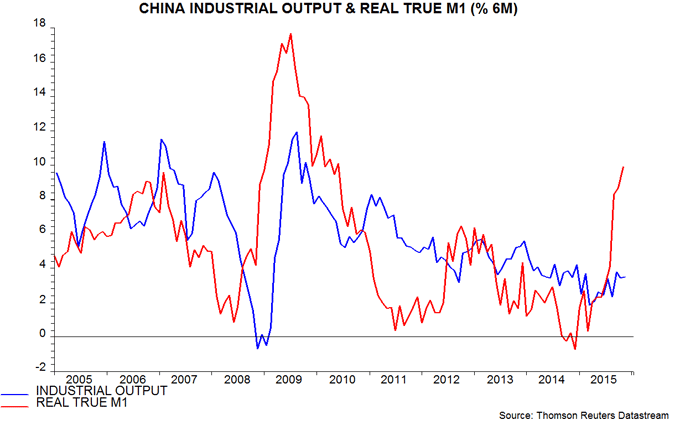
Real (i.e. CPI-deflated) true M1 surged by 9.9%, or 20.8% at an annualised rate, in the six months to November, suggesting a powerful rebound in economic growth from early 2016 through the summer, allowing for a typical nine-month lead – third chart.
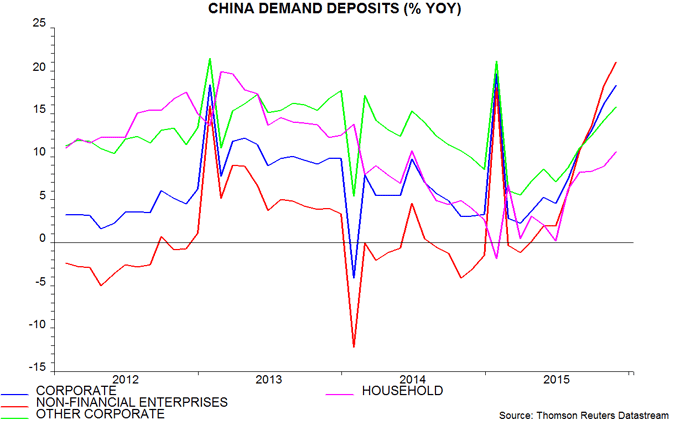
Demand deposits of non-financial enterprises, other corporate entities and households have all accelerated strongly over the past six months – fourth chart. A claim that the M1 surge has been narrowly focused on demand deposits of local government financing vehicles, therefore, is false. (Such vehicles are included in the “other corporate” segment.) The breadth of improvement suggests improving prospects for both business and consumer spending.
*True M1 = official M1 plus household demand deposits. Official M1 = currency in circulation plus corporate demand deposits.


