Entries from November 15, 2015 - November 21, 2015
German trucking activity suggesting stronger economy
The "toll index" produced by the IZA research institute measures domestic trucking activity using data from the system that levies road tolls. Unsurprisingly, it is usually a good coincident indicator of industrial activity. The chart compares year-on-year percentage changes of industrial output and aggregate kilometres driven, using monthly data unadjusted for seasonals. The toll index has diverged positively from industrial output in recent months and rose sharply further in October (October output will be released on 7 December). Trucking activity has presumably been boosted by a need to transport supplies to incoming refugees but this should still signal a stronger economy, to the extent that the supplies are sourced domestically.

G7 core inflation up again, Japanese exports rebounding
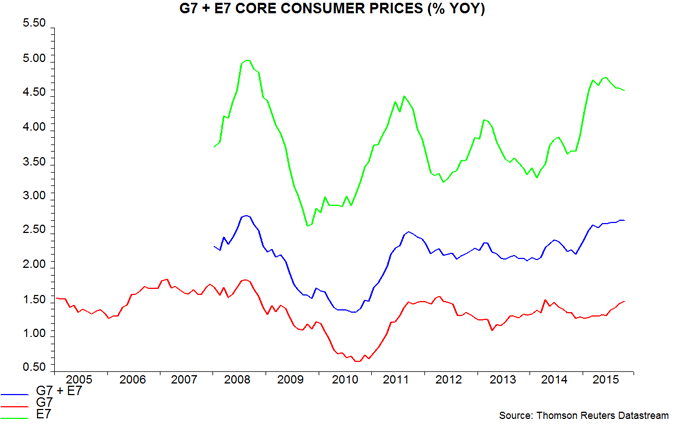
Annual “core” consumer price inflation in the G7 countries and seven large emerging economies is estimated to have remained stable at 2.7% in October, a seven-year high*. A further rise in the G7 was offset by a fall in the E7, where the core rate may have peaked in June – see first chart.
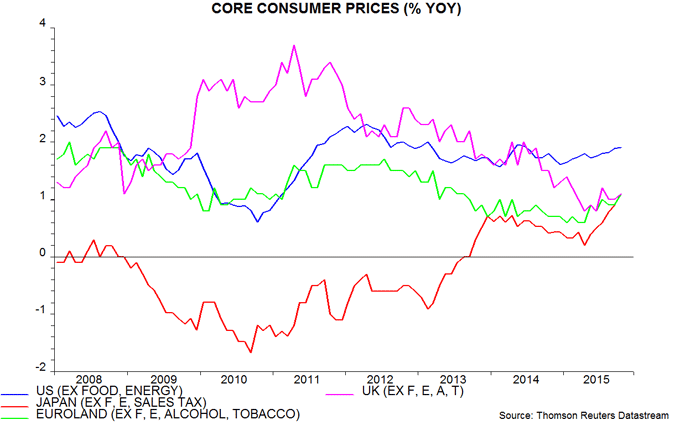
Core inflation has moved up across the major developed economies this year, with the largest rises in Japan and the Eurozone – second chart. The Eurozone core rate has recovered from 0.6% in early 2015 to 1.1%, reflecting higher services as well as goods inflation, with the former increasing from 1.0% to 1.3%. Monetary policy changes take up to two years to have their maximum impact on inflation**, so the recent increase in the Eurozone core rate appears consistent with returning inflation to the target of “below, but close to, 2%” by end-2016. QE and expected further action in December may be laying the foundation for an overshoot in 2017-18.
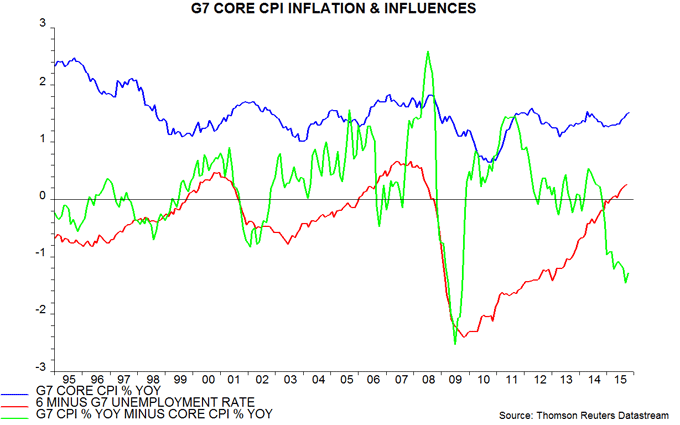
Two key influences on G7 core inflation trends are labour market tightness and pass-through of lower commodity prices, both directly and via temporarily reduced wage pressures. In common with rises in 2000-01 and 2006, this year’s increase in core inflation followed a fall in the G7 unemployment rate below 6% – third chart.
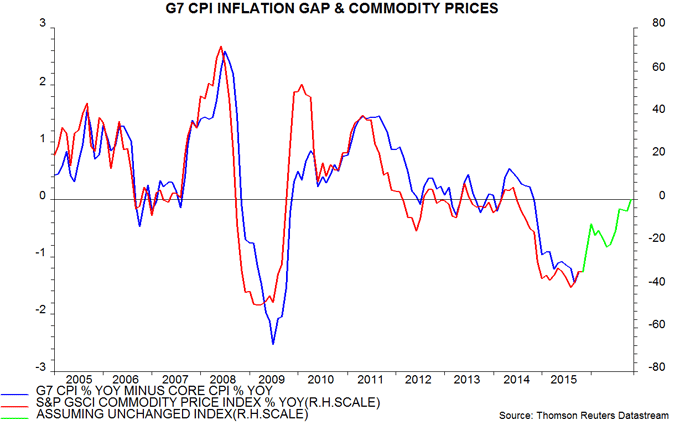
The commodity price influence can be measured by the gap between G7 headline and core inflation, which was recently the most negative since 2009 – third chart. The gap, however, is forecast to narrow sharply in early 2016 and will close by late next year if commodity prices stabilise – fourth chart. Unless labour markets loosen, this suggests further upward pressure on the core rate.
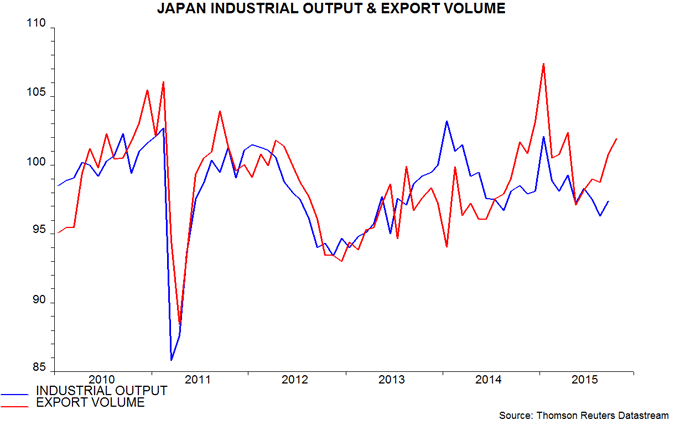
The view that the global economy is regaining momentum, meanwhile, is supported by October Japanese trade numbers, showing export volume up by a further 1.1% last month, consistent with a METI survey forecast of a solid increase in industrial output – fifth chart.
*October available for all countries except Japan and Canada; Japan estimated from Tokyo data, Canada assumed unchanged. Core definition varies slightly across countries but in most cases excludes all food and energy items. See footnote in previous post for details.
**Source: Bank of England.
