Entries from October 4, 2015 - October 10, 2015
A "monetarist" perspective on current equity markets
Equity markets weakened during the third quarter amid investor concerns about the impact of expected Federal Reserve policy tightening and slower growth in China and other emerging economies. Our monetary analysis suggests that the Chinese economy will regain momentum in late 2015 / early 2016, while US growth will remain moderate, allowing the Fed to proceed cautiously with rate rises. Such a scenario would probably be favourable for markets.
The equity swoon was not, in our view, due to any negative shift in current liquidity conditions. Global real (i.e. inflation-adjusted) money growth is solid by historical standards and well above economic output expansion, implying “excess” liquidity – see first chart*. Central bank policies, meanwhile, remain expansionary, with QE programmes proceeding in Japan and the Eurozone, and China and India cutting official rates and reserve requirements last quarter.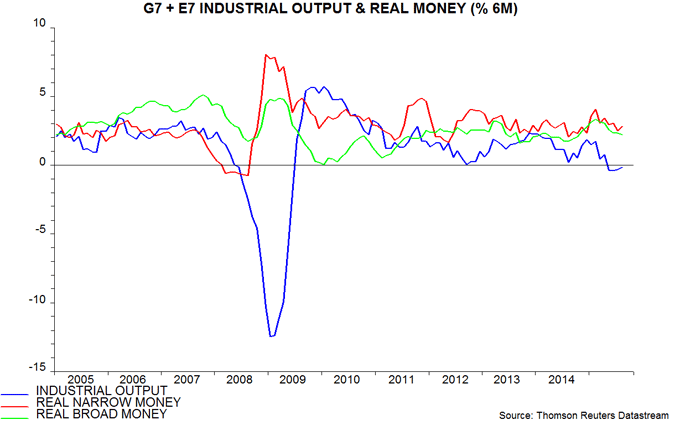
Rather than tighter liquidity, we attribute market weakness to a rise in investor risk aversion due to Fed / EM concerns and a series of negative “shocks”, including another Greek “crisis” in July, a change in China’s exchange rate policy in August and the Volkswagen emissions cheating scandal in September. Investors are now overly pessimistic about economic and earnings prospects, in our view.
China is key to the outlook. Industrial output growth slowed sharply in early 2015 and remained below-par over the summer. This weakness had been signalled by a contraction of our preferred real money measure in late 2014 – second chart**. This measure, however, has rebounded since early 2015, indicating that People’s Bank of China (PBOC) policy easing has more than offset a liquidity drain from foreign exchange intervention to support the renminbi. Fiscal policy is also turning expansionary, having been unintentionally harsh in early 2015. Economic news, therefore, should improve in late 2015 / early 2016.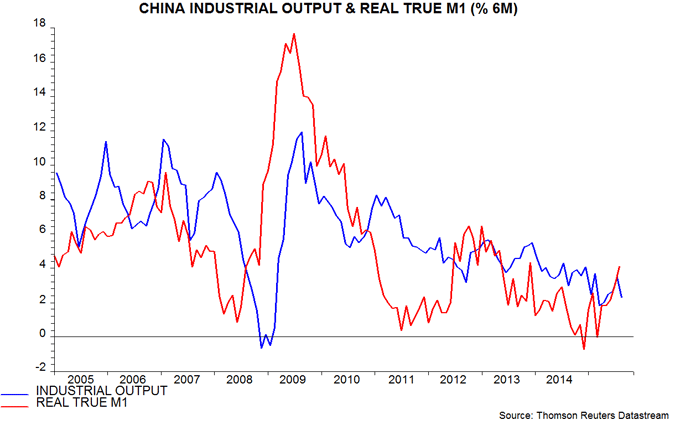
Pessimists counter that the slump in Chinese stock prices will depress consumption, while exports will remain weak unless the exchange rate is allowed to fall significantly. Stocks, however, are not widely owned and consumer confidence has risen over the summer, partly reflecting a reviving housing market. Chinese exports, meanwhile, are outperforming, arguing against claims that the currency is overvalued: a 5.5% fall in US dollar terms in the year to August compares with a double-digit decline in global trade. The change to the fixing mechanism in August appears to have been made in order to satisfy conditions for the renminbi to be added to the basket of currencies forming the IMF’s special drawing right (SDR), rather than to open the door to a large depreciation.
Consensus pessimism about China contrasts with optimism about US economic prospects and associated worries that the Fed will be forced to tighten monetary policy significantly. US real money growth, however, has fallen sharply since early 2015 and is now below the pace in other G7 countries, suggesting that economic expansion will slow in late 2015 / early 2016 – third chart. The Fed is still likely to raise interest rates in response to a gradually tightening labour market but the risk of a series of closely-spaced increases has receded.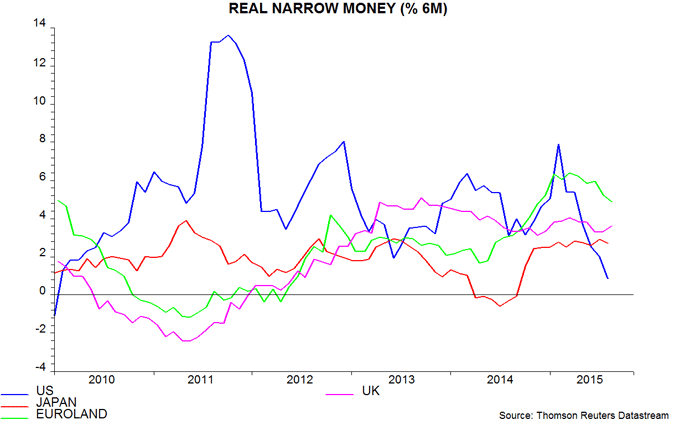
Opposite US / Chinese money trends have contributed to a convergence of real money growth between the G7 and an “E7” grouping of seven large emerging economies – fourth chart. Historical evidence suggests that the sign of the E7 / G7 real money growth gap is relevant for assessing whether EM equities will outperform developed markets: for example, EM stocks outperformed when the gap was last significantly positive in 2010-11 but have lagged since it turned negative in 2011. An increase in EM exposure may be warranted if the current small positive gap is sustained or widens further.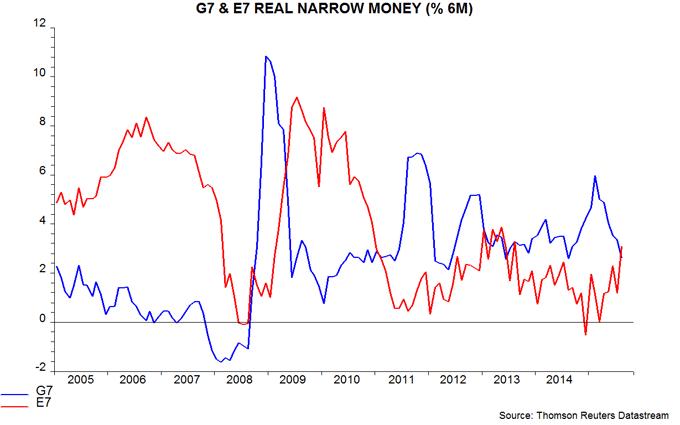
Within developed markets, real money growth is strong in Sweden, Australia and the Eurozone and weak in Switzerland as well as the US, with Canada, the UK and Japan mid-range – fifth chart. Economic and equity market prospects may be better in the former group. Within the Eurozone, real money growth is notably robust in France and is slightly higher in the “core” than the “periphery”***.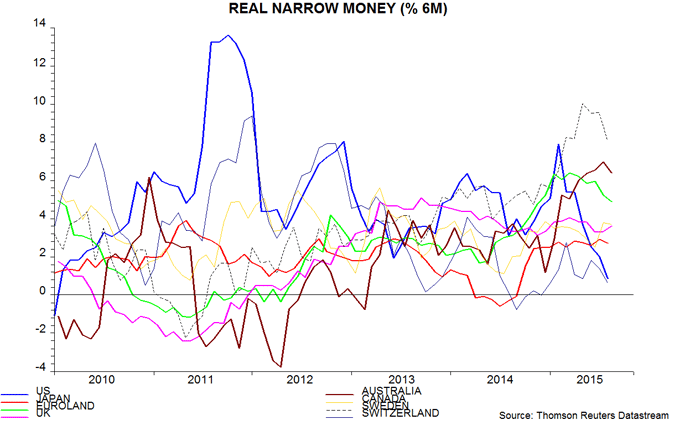
In emerging markets, real money growth is strong in Korea and Mexico, and solid in China, Taiwan and India; the pace of contraction has slowed sharply in Russia but remains alarming in Brazil, probably reflecting very high real interest rates – sixth chart. Favourable monetary trends in most EM economies support the view that consensus pessimism is overblown.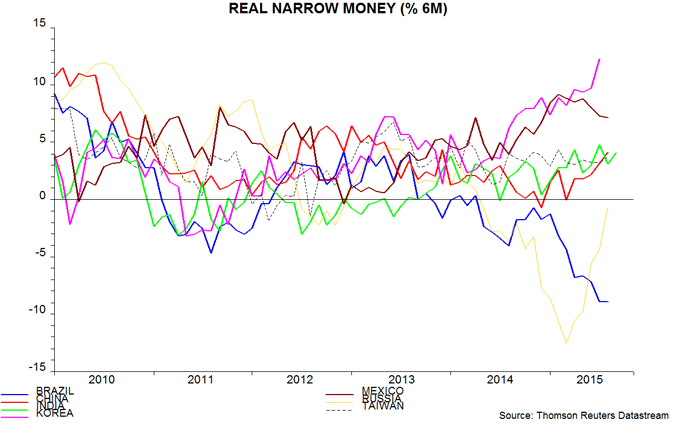
*”Global” = G7 developed countries and seven large emerging economies (“E7”). Narrow money = currency in circulation plus demand deposits and close substitutes. Broad money = narrow money plus time deposits, notice accounts, repos and bank securities. Precise definitions vary by country. Narrow money has been more reliable than broad money for forecasting purposes historically and is consequently emphasised in the analysis here.
**True M1 = currency in circulation plus demand deposits of corporations, government organisations and households.
***”Core” = Germany, France, Netherlands, Belgium, Austria, Luxembourg; “periphery” = Italy, Spain, Ireland, Portugal, Greece.
Global "core" inflation stable through boom, bust and recovery
A remarkable feature of the past decade has been the stability of global “core” inflation. Headline inflation has fluctuated significantly as a result of commodity price swings but the annual increase in G7 consumer prices excluding food and energy has been confined within a narrow range of 0.7% to 2.0%, averaging 1.5% – see chart. The latest reading, for August, was 1.5%.
Supporters of current central bank orthodoxy might cite this stability as evidence of the success of inflation-targeting. The aim of policy, however, has been to maintain steady, low inflation by ensuring smooth economic growth in line with potential, avoiding booms and busts. The reality, of course, has been far removed from this ideal. Inflation has been stable despite central bankers’ failure to limit economic and financial volatility.
The observed stability contradicts the dominant “Phillips curve” understanding of the inflation process, to which central bankers continue to appeal to justify their policy decisions. This asserts that inflation trends higher when the “output gap” – the deviation of GDP from its potential level – is positive, and lower when it is negative. While there are huge measurement uncertainties, few would dispute that the output gap was significantly positive at the peak of the credit bubble in 2007 and heavily negative at the bottom of the “great recession” in 2009. Yet G7 core inflation was stable in 2007-08 and fell only modestly in 2009-10, recovering in 2011 when the gap was still, presumably, negative.
An alternative monetarist view is that inflation follows swings in money growth with a long lag. This is true of large and sustained changes in money growth, such as occurred in the 1960s / 1970s (up) and 1980s / 1990s (down). G7 money growth, however, has shown no clear trend since the 1990s and there has been limited pass-through of short-term fluctuations to core inflation.
The stability of core inflation, and trend money growth, suggests little risk of “deflation”. With inflation “anchored”, central banks should give greater weight to financial stability and medium-term growth objectives in setting policy. This argues for raising interest rates to encourage saving and deter financial speculation and capital misallocation. 

