Entries from September 6, 2015 - September 12, 2015
Chinese money numbers better despite f/x intervention
Chinese headline money numbers for August were moderately encouraging, suggesting that policy easing is gaining traction. Annual growth of the broader M2 measure was unchanged from July at 13.3%, the fastest since July 2014. Narrow money M1 growth, meanwhile, jumped from 6.6% to 9.3% – see first chart.
The August numbers contradict claims that heavy currency intervention would result in a contraction of domestic liquidity. Foreign exchange reserves fell by $93.9 billion in August, equivalent to 0.4% of the stock of M2 and 1.6% of M1. The impact of balance of payments flows on the money supply, however, is usually swamped by other influences – in this case, monetary and fiscal policy loosening.
The preferred money measure here is “true M1”, which adds household demand deposits to the official M1 measure*. An August figure for household demand deposits is not yet available; unless they fall sharply, however, annual true M1 expansion will rise further from July’s 6.4%.
The six-month change in real (i.e. CPI-adjusted) true M1 turned negative at end-2014, signalling economic weakness during the first half of 2015. It recovered, however, through July – second chart. Industrial output regained momentum in the early summer, although the August number due shortly may show a relapse, judging from survey evidence.
Broad credit trends remain soft: the estimated stock of “total social financing” rose by an annual 11.7% in August, down from 14.5% a year earlier**. Growth, however, has stabilised recently, consistent with a trough in economic momentum.
*The exclusion of household demand deposits from the official measure may reflect their historical unimportance. Official M1 = cash in circulation plus demand deposits of corporations and government organisations.
**Stock estimated by cumulating historical flows.


Chinese exports still outperforming
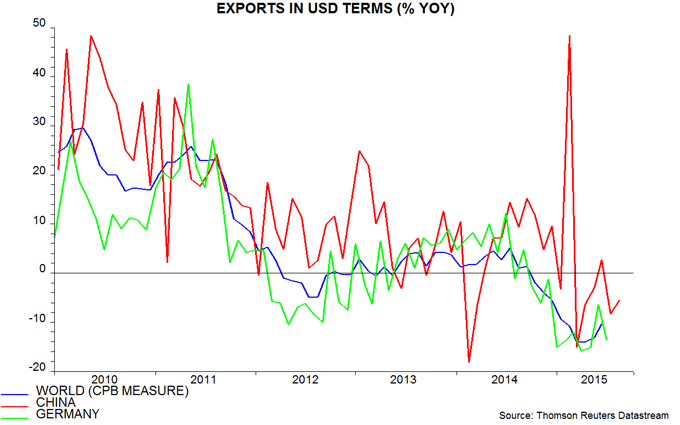
The dollar value of Chinese exports fell by 5.5% in the year to August, after an 8.3% annual decline in July. This weakness, however, mainly reflects the strong dollar: Chinese exports are still gaining market share.
The dollar value of global exports fell by 10.4% in the year to June, the latest available month, based on data compiled by the Dutch CPB research institute. Chinese exports rose by an annual 2.8% in the same month.
The June numbers are not exceptional: the annual change in Chinese exports has been mostly significantly higher than that of the global total recently – see first chart. There is little sign, in other words, that the trend increase in China’s export market share is slowing, let alone stalling or reversing.
German July trade figures also released today showed 6.2% annual growth in exports – but in devalued euro terms. Expressed in dollars, German exports were down by 13.6% in July – much worse than the 8.3% Chinese decline.
China is also outperforming other Asia countries: Korean and Taiwanese exports, for example, were down by 14.7% and 14.8% respectively in the year to August.
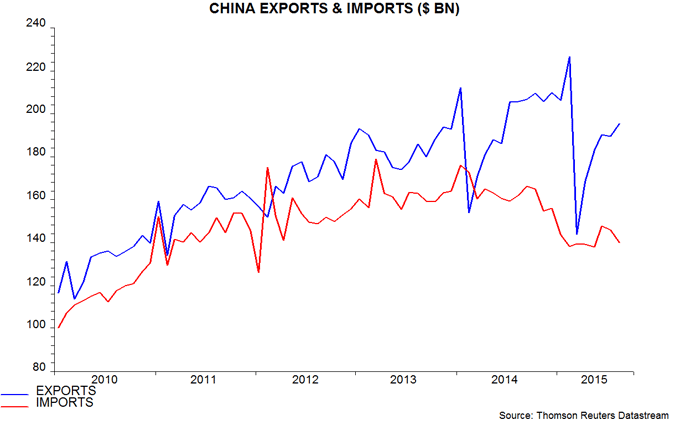
A crude seasonal adjustment of the Chinese data suggests that exports bottomed in March*, recovering further in August – second chart.
The rising market share contradicts claims that an uncompetitive exchange rate is depressing exports and growth. A further devaluation would probably have a negative net impact on growth, as additional capital outflows resulted in tighter domestic monetary conditions.
*The unusually late timing of the New Year holiday may have raised February exports at the expense of March.


