Entries from July 26, 2015 - August 1, 2015
Global growth: business surveys supporting H2 pick-up
Previous posts suggested that global economic growth would revive from mid-2015, reflecting stronger developed-world demand following a pick-up in real money expansion in late 2014 / early 2015. Incoming business survey results are consistent with this forecast. The first chart shows a selection of developed-country manufacturing survey indicators for which a July reading is available. Four of the five have recovered significantly since the spring, with all now above their average levels since 2010.
The obvious concern is that a revival in developed-world demand will be offset by further weakness in China and other emerging economies. The Markit Chinese PMI manufacturing new orders index fell sharply in July but is above previous lows over 2011-14, when industrial output was rising more strongly than recently – second chart. The survey responses may have been influenced by recent stock market turmoil; the equity analysts’ earnings revisions ratio was stable in July. Official PMI survey results, based on a larger sample, will be released shortly.
Monetary trends do not suggest a deterioration in emerging-world economic prospects. Six-month real narrow money growth in the “E7” large economies, indeed, has firmed recently, while G7 expansion continues to moderate from its February peak; the G7 / E7 gap is at a nine-month low – third chart*. Reflecting the G7 slowdown, the preferred scenario here is that stronger global economic growth during the second half will give way to another moderation from early 2016 – see previous post.
*E7 June datapoint estimated based on data for five countries.


UK money trends still solid
UK money / inflation trends suggest that economic growth will firm during the second half of 2015 before moderating again in early 2016.
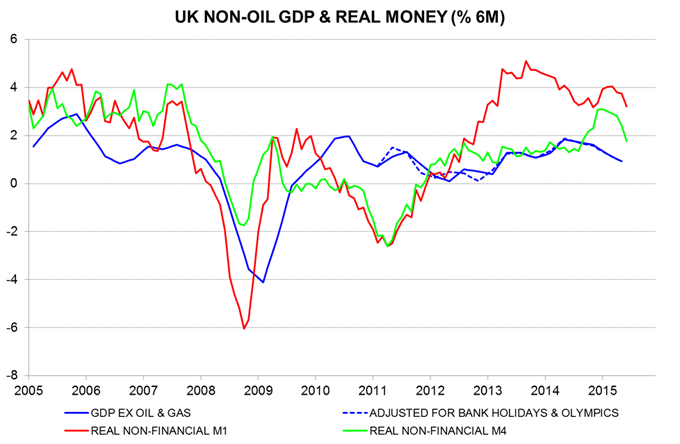
The best monetary leading indicator of the economy is “real non-financial M1”, defined as the stock of notes / coin and sight deposits held by households and private non-financial corporations deflated by consumer prices. This measure gave advance warning of the 2008-09 recession, the 2011-12 “double dip” scare and the 2013 growth surge – see first chart.
It also correctly signalled the recent modest economic slowdown. Six-month growth of real non-financial M1 peaked in September 2013, while the two-quarter increase in non-oil GDP topped out in the second quarter of 2014 – the difference of about eight months is in line with the Friedman / Schwarz finding of a typical lead time from money to output of between six and nine months*.
The two-quarter non-oil GDP change continued to moderate in the second quarter but is probably bottoming. Six-month real non-financial M1 growth stabilised between August and December 2014 before strengthening in early 2015, peaking in March. This suggests that two-quarter GDP expansion will rise to another top in either the fourth quarter of 2015 or the first quarter of 2016.
Quarterly GDP rises in the third and fourth quarters may exceed 0.6%, satisfying one of Bank of England Governor Mark Carney’s latest three conditions for policy tightening (the others being a pick-up in unit labour cost growth and a recovery in “core” inflation).
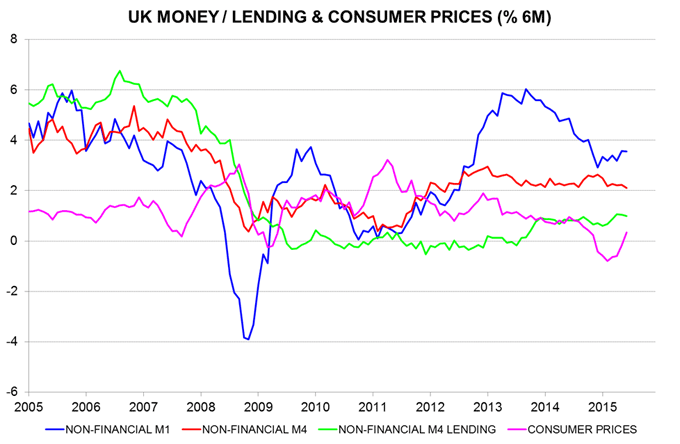
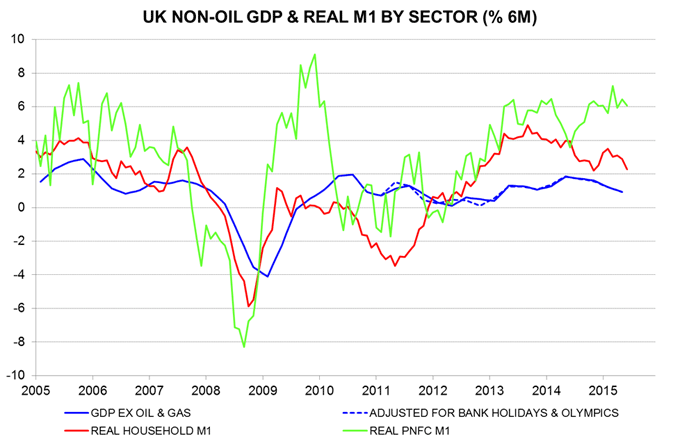
The fall in real non-financial M1 growth since March may not signal a significant economic slowdown from early 2016, for two reasons. First, the decline reflects a recovery in six-month consumer price inflation rather than lower nominal money expansion – second chart. Secondly, real corporate M1 continues rise fast and is better correlated with future economic performance than household M1 – third chart.
*A study here of G7 data since the 1960s found an average lead time between real narrow money and industrial output of nine months (further details on request).


Eurozone money trends still solid
Eurozone monetary trends continue to suggest a positive economic outlook. Narrow money M1 rose by a strong 0.9% in June, with the broader M3 measure up by 0.3%. Loans to the private sector, adjusted for sales and securitisation, were unchanged on the month but this reflected repayments by financial companies – loans to households and non-financial corporations increased by 0.2%.
Six-month M1 growth rose to 6.6%, or 13.6% annualised, the highest since February 2009 – see first chart. The 2008-09 pick-up preceded solid economic expansion, with GDP rising by 2.2% between the second quarters of 2009 and 2010. Growth of real M1 (i.e. deflated by consumer prices) has moved sideways since January as inflation has recovered but is significantly faster than in most other economies – second chart.
While money trends remain expansionary, there is little in the data to suggest a positive impact from QE. The monthly rise in M3 averaged 0.4% over March-June, down from 0.5% over November-February, before QE started. This accords with experience in the US, UK and Japan, discussed in previous posts. QE effects on broad money are small because of offsetting changes in the other “credit counterparts”: for example, banks have switched from buying to selling government securities since QE started, with sales of €36 billion over March-June.
Country detail shows solid growth of real M1 deposits across the big four economies, with France leading and Italy lagging – third chart. Also notable are continued strength in Ireland and a sharp rebound in Portugal, consistent with a lack of contagion from Greece’s self-imposed crisis – fourth chart.


