
Entries from April 12, 2015 - April 18, 2015
ECB policy too loose if no "Grexit"
 Simon Ward
 Post a Comment
In its October 2014 World Economic Outlook (WEO), the IMF downgraded its Eurozone growth forecast and warned of a 38% risk of a recession. Its pessimism was representative of the consensus at the time but was viewed here as groundless, because monetary trends were signalling an improving economic outlook – see previous post.
In its latest WEO, the IMF raised its 2015 GDP growth forecast to 1.5%. Its estimate of recession risk, however, remains high, at 25% between the second and fourth quarters of 2015. This assessment, on the face of it, is inconsistent with current positive economic and monetary trends.
A likely explanation is that the IMF expects a Greek default and / or EMU exit and views this as a significant risk to the emerging economic upswing.
Concern about a negative shock from “Grexit” probably played a key role in the ECB’s decision to launch QE. The ECB’s economists monitor monetary trends closely and will have recognised the signal of improving prospects in late 2014. The sharp fall in inflation, meanwhile, was clearly due to external commodity price weakness, with the “core” rate – excluding energy, food, alcohol and tobacco – remaining stable. This suggests that ECB President Draghi’s claim of heightened deflation risk, promulgated by useful idiots in the media, was a smokescreen to push through QE, the main purpose of which was to protect other peripheral bond markets from contagion from a Greek default / exit.
The IMF / ECB concerns about the threat posed by a Greek crisis cannot be dismissed. Major defaults are often a harbinger of a sustained deterioration in financial and economic conditions. Such defaults, however, are usually the result of increased borrower stress due to a tightening of liquidity conditions rather than a voluntary decision to repudiate debt.
Current ECB policy is calibrated to deal with a possible financial crisis and is excessively accommodative relative to current economic and monetary trends. If "Grexit" is avoided or its fall-out contained, Mr Draghi’s dismissal of QE tapering is likely to prove “premature”.
Chinese money / lending trends signalling moderate growth
The Chinese economy slowed sharply in early 2015 but money / lending trends are consistent with moderate economic expansion over coming months. Further policy easing, nevertheless, is likely.
Annual growth of real GDP was 7.0% in the first quarter, down from 7.3% in the fourth quarter of 2014 but in line with the 2015 target. This result, however, is difficult to reconcile with much weaker nominal (i.e. current price) data: annual nominal GDP growth fell from 7.7% to 5.8% between the two quarters.
The preferred growth measure here is the six-month change in industrial output*. This slumped to 1.5% in March, or 3.1% annualised – the lowest since 2009.
The Chinese New Year holiday occurred later than usual in 2015, which may have resulted in production being shifted from March to February. Combining the two months, however, six-month output growth was still only 2.6%, or 5.3% annualised.
The recent economic slowdown was signalled by weaker monetary trends in late 2014. Six-month growth of real M2 fell to a 39-month low in December – see chart. It has, however, stabilised in early 2015. The fall in output growth appears exaggerated relative to the current level of real M2 expansion, suggesting some recovery.
Growth of real bank lending, meanwhile, has picked up since late 2014. The normal approach here is to regard credit as a coincident or lagging indicator of economic activity but, in China’s case, it appears to lead. This may reflect the importance of supply shifts in driving credit changes in China, with such shifts often related to policy measures designed to boost or restrain economic growth. In the major developed economies, by contrast, credit demand is typically a stronger influence on lending fluctuations than supply changes. Credit demand depends partly on current economic trends, explaining the coincident / lagging relationship.
Six-month growth of real bank lending slipped back in March but remains above its average in recent years. Medium- and longer-term loans for infrastructure investment and real estate have led recent strength, consistent with official initiatives to boost these areas. Admittedly, overall credit – as measured by “total social financing” – is growing more slowly than bank lending, reflecting weakness in “shadow banking” (i.e. trust loans, entrusted loans and bankers’ acceptances) . Such shadow activities, however, may have less direct implication for economic trends than bank lending. In any case, six-month growth of real total credit, like M2, has moved sideways since end-2014
Today’s weak economic news is likely to result in further policy easing, despite concerns about a bubbly stock market. Together with reassuring money and credit trends, this suggests improving second-half economic prospects, when China should also benefit from stronger global demand – see previous post.
*World Bank seasonally-adjusted level series updated using annual growth data.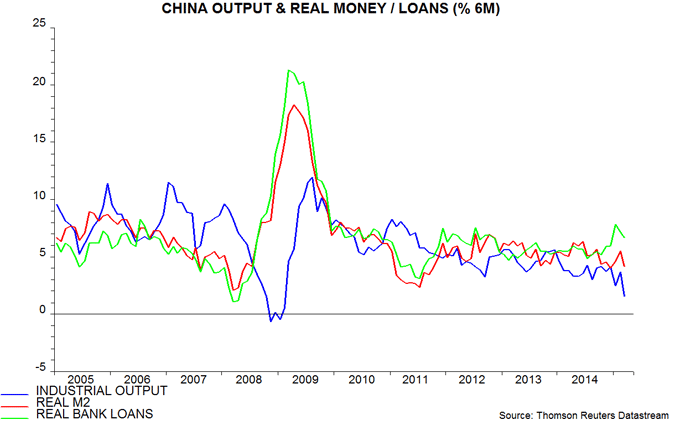
Eurozone news still surprising positively
The ECB’s April bank lending survey, released today, provides further confirmation of a strong economic pick-up. Credit demand, in particular, is surging: the net percentages of banks expecting increased demand for corporate and house purchase loans over the next three months rose to the highest levels recorded in the survey’s 12-year history – see first chart.
Stronger credit demand reflects increased economic confidence and recent falls in lending rates, mostly due to the ECB’s rate cuts and TLTRO liquidity operations. QE is too recent to have been a significant influence.
In other Eurozone news, industrial output rose by 1.1% in February after a downwardly-revised 0.3% fall in January. Output in January / February combined was 0.9% above the fourth-quarter level. Retail sales, meanwhile, were 1.2% higher in January / February than in the fourth quarter. These gains are consistent with first-quarter GDP growth of 0.8%, according to a simple tracking model – second chart. Output and sales, however, may pull back temporarily in March following recent strong rises, lowering the quarterly averages. 
Brighter Japanese outlook no thanks to QE
Japanese monetary trends continue to signal respectable economic performance but are less strong than in the Eurozone and US, despite record QE.
Narrow money M1 and broad money M3 rose by 0.3% and 0.2% respectively in March. Six-month growth rates eased to 2.6% for M1 and 1.6% for M3, or 5.3% and 3.2% annualised respectively – see first chart. For comparison, Eurozone M1 and M3 rose by 11.8% and 5.1% annualised in the six months to February, the latest available month.
M1 and M3 slowed in late 2013 / early 2014 – first chart. With inflation boosted by the April 2014 sales tax hike, real money contracted, correctly signalling economic weakness – second chart. Nominal money growth recovered during the second half of 2014 while six-month inflation has fallen back, reflecting both a reversal of the sales tax effect and weaker energy prices. Real money trends, therefore, are again consistent with respectable economic expansion.
The bigger story is that QE appears to have had little impact on monetary growth in recent years. The annual increase in M3 stood at 2.1% when the Bank of Japan (BoJ) launched QE in October 2010. It was 3.0% in March 2015. The BoJ is currently buying securities at an annual pace of ¥83 trillion, equivalent to 6.8% of M3. This suggests QE “pass-through” of 13% (i.e. 0.9 as a percentage of 6.8). An earlier analysis of UK QE arrived at a similar pass-through estimate of 21% – much lower than the Bank of England’s claimed 59%.
What explains the high “leakage”? An analysis of the monetary counterparts shows that the increase in BoJ lending to the government has been offset by a reduction in bank exposure. Banks have cut their lending because QE has boosted their reserves at the BoJ, meaning that they need to hold fewer government bonds to meet liquidity targets*. When QE started in October 2010, combined lending to the government by the BoJ and banks was contributing 3.3 percentage points (pp) to annual broad money growth, comprising 0.5 pp from the BoJ and 2.7 pp from banks** – third chart. On the latest figures, for January 2015, the combined contribution was 2.9 pp, with the BoJ adding 5.3 pp but banks subtracting 2.4 pp.
Near-term economic prospects may be improving but the BoJ deserves little credit.
*This response was predicted in a post in April 2013.
**Difference due to rounding.


