Entries from March 1, 2015 - March 7, 2015
US money trends signalling H2 growth rebound
 Simon Ward
 Post a Comment
A post in September noted that US narrow money growth had fallen sharply and was signalling a loss of economic momentum in early 2015, allowing for the usual lag. US economic news has mostly disappointed recently, reflected in a significant negative reading of the Citigroup US data surprise index, while the Atlanta Fed’s “nowcast” model suggests GDP growth in the first quarter of only 1.2% annualised.
The slowdown predicted by monetary trends has been magnified by cuts in oil and gas extraction-related investment and employment. New advertisements for extraction jobs and related high-education occupations plunged by 42% and 38% respectively between November and January, according to the Conference Board.
Some commentators claim that economic weakness will be sustained through 2015, with familiar voices even suggesting that a recession is looming. This is not the message from the latest monetary trends.
As discussed in a post in January, six-month growth of US real (i.e. inflation-adjusted) narrow money recovered at end-2014, reflecting an energy-driven fall in consumer prices. The revival continued in January and available weekly data for February suggest a further large gain, this time driven by stronger nominal expansion – see chart*.
Broader money measures have also reaccelerated. Based on the weekly data, six-month growth of real M2 probably rose to 4.0% in February, or 8.1% annualised – the highest since December 2011.
Monetary trends, therefore, suggest that current economic weakness will extend into the second quarter but growth will bounce back strongly in the second half of 2015.
Previous posts (e.g. here) noted that 10 of the 11 US recessions since World War Two were preceded by a contraction of real narrow money, the exception being 1953-54 downturn, which may have been caused by fiscal tightening as defence spending was slashed after the Korean War. A 2015 recession remains unlikely, with the latest monetary trends suggesting a receding risk.
*The February estimate is based on the average level of narrow money through 23 February and an assumed 0.4% monthly increase in consumer prices.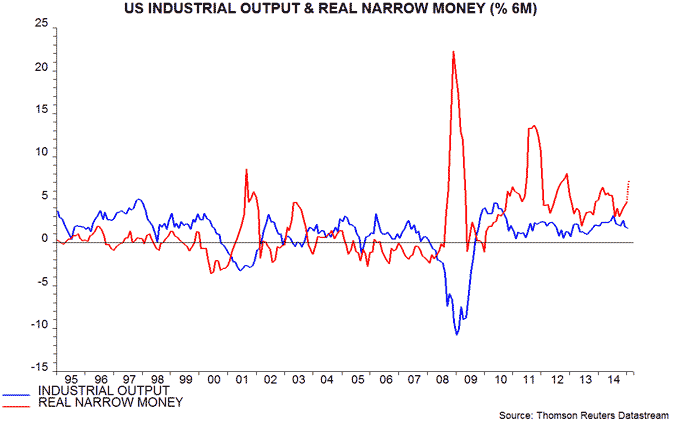
G7 "core" inflation stable, close to 10-year average
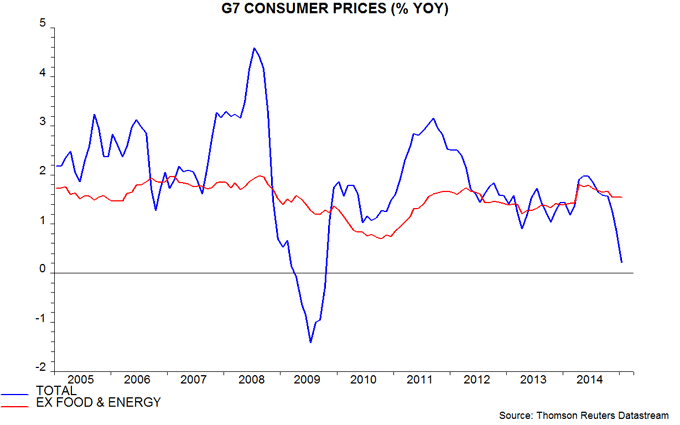
G7 annual consumer price inflation fell to 0.2% in January, the lowest since October 2009, but the “core” rate excluding food and energy was unchanged at 1.6% – see first chart. Stable core inflation suggests that deflation worries are overblown.
The G7 headline and core rates are currently subject to a small upward distortion from last April's Japanese sales tax hike. Without this, core inflation would be 1.4% – close to its average of 1.5% since 2005.
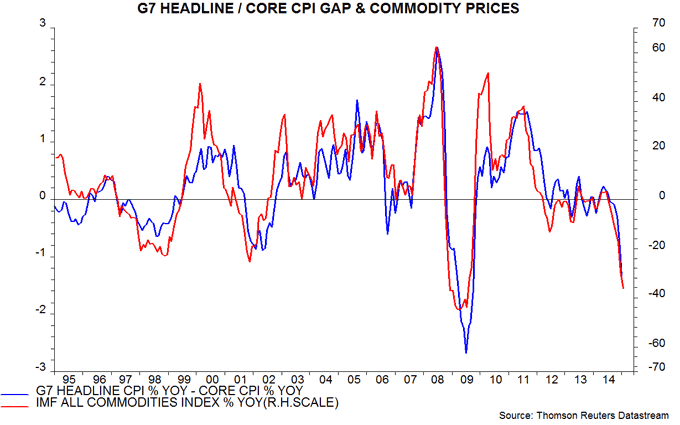
The second chart shows the headline / core inflation gap and the annual rate of change of commodity prices, as measured by the IMF’s all-items index. The headline / core gap is probably at or close to a bottom, assuming no further fall in commodity prices.
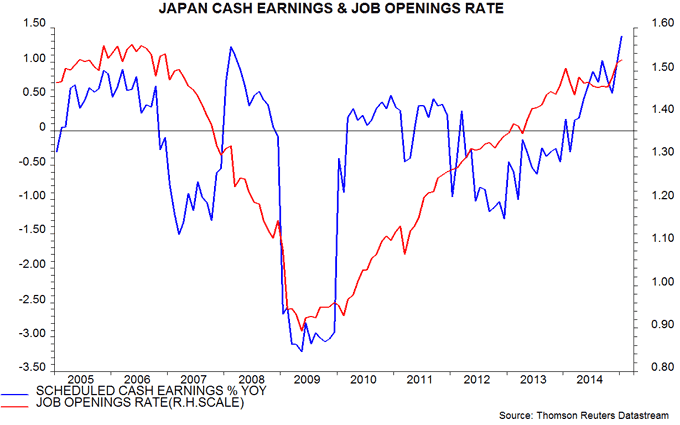
Core inflation is likely to be supported by increasingly tight labour markets and associated upward pressure on wages and unit labour costs. As previously discussed, job openings rates (i.e. vacancies expressed as a percentage of filled and unfilled jobs) are at or above their 2000s cyclical highs in the US, Japan, Germany and the UK. Wage growth is firming in all four economies, while productivity trends remain weak.
In Japan, annual growth in scheduled earnings (i.e. excluding overtime and bonuses) at firms with 30 or more employees rose to 1.3% in January, a 15-year high – third chart. With the job openings rate up again, and profits buoyant, workers are in a strong position to push for further wage gains in the spring “shunto”.
UK money trends still positive, pensioner bonds affecting data
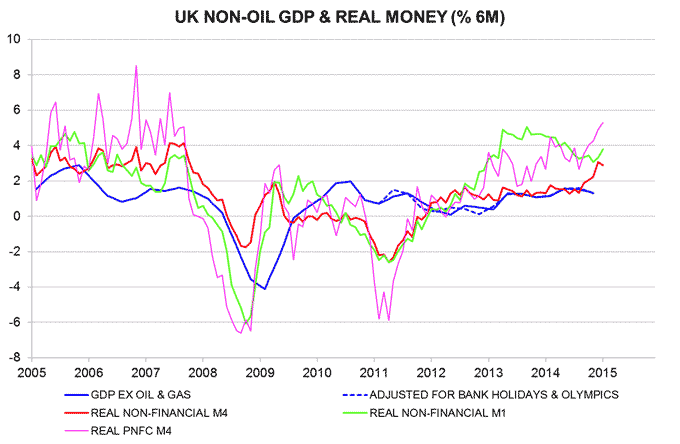
UK monetary trends remain consistent with solid economic growth. Broad money was held back in January by a transfer of funds out of bank deposits into the new National Savings pensioner bonds. Narrow money was less affected by this shift and continues to expand strongly, though is now lagging the equivalent Eurozone measure.
The Bank of England’s favoured broad money measure – M4 excluding holdings of “intermediate other financial corporations”, or M4ex – rose by 0.1% in January but was depressed by a record £6.6 billion monthly inflow to National Savings, reflecting strong demand for 65+ pensioner bonds. This largely explains a £10 billion withdrawal from household interest-bearing deposits. National Savings inflows were in a £400-700 million range in the prior six months, suggesting a £6 billion impact from the new bonds, equivalent to 0.3% of M4ex.
Chancellor George Osborne last month announced that the bonds would remain on sale until 15 May, with take-up now expected to reach £15 billion, or 0.8% of M4ex.
Narrow money M1 – comprising physical cash and sight deposits – appears to have been little affected by the bond sales, rising by a solid 0.8% in January.
The forecasting approach here focuses on six-month growth of real (i.e. inflation-adjusted) “non-financial” M1 and M4, covering holdings of households and private non-financial firms (i.e. excluding all financial corporations). Both measures are still giving a positive message for economic prospects – see first chart.
Corporate M4 holdings are growing particularly strongly – encouraging since corporate liquidity is better correlated with future economic growth than household M4.
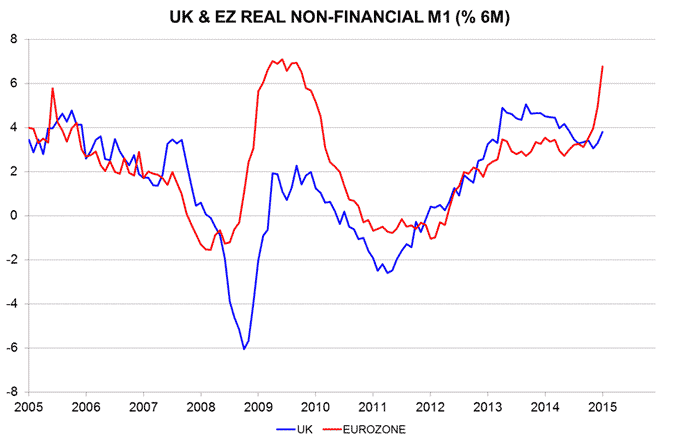
Real money trends, however, are now stronger in the Eurozone than the UK, suggesting that the period of UK economic outperformance since 2011 is ending – second chart.
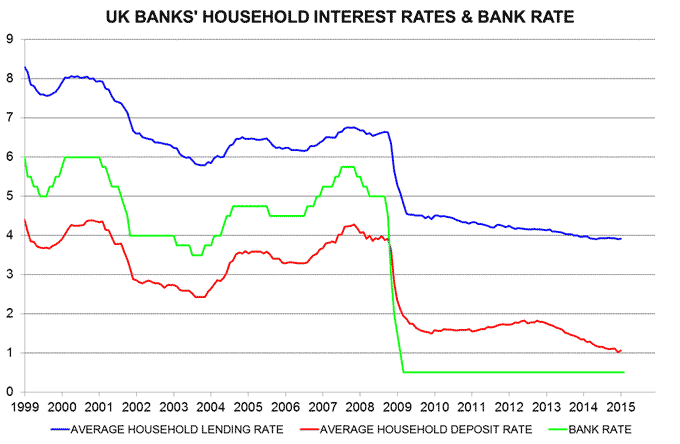
Increased competition from National Savings probably contributed to a small uptick in the average interest rate on household bank deposits in January. Deposit and, to a lesser extent, lending rates trended lower over 2013-14, delivering a stealth loosening of monetary policy – third chart. This boost is now fading.