
Entries from February 15, 2015 - February 21, 2015
Global real money signalling strong H2 economy
 Simon Ward
 Post a Comment
Global growth has recovered since the summer, in line with a forecast based on monetary trends and leading indicators. This forecasting approach now suggests that growth will pull back slightly into the spring before moving higher again in the second half of 2015.
Global growth can be proxied on a timely basis by the six-month rate of change of industrial output in the G7 and seven large emerging economies (the “E7”). This bottomed in August 2014, rising to an eight-month high in December. A recovery had been signalled by strong G7 plus E7 real (i.e. inflation-adjusted) narrow money expansion in late 2013 / early 2014 and a subsequent increase in the composite longer leading indicator tracked here – see first chart.
Six-month G7 plus E7 output growth may remain around December’s level or move higher in January / February. Japanese production appears to have increased significantly in January – export volume rose by 5.0% – while G7 plus E7 output declined in July / August 2014, implying a favourable base effect.
G7 plus E7 real narrow money expansion, however, fell back in mid 2014, reaching a low in August before rebounding. The lead time of money to output has recently been somewhat longer than the historical average of about six months. The 2014 slowdown in real money, therefore, may be reflected in a pull-back in output growth this spring.
Any growth decline is likely to be modest and temporary for two reasons. First, the G7 plus E7 longer leading indicator has continued to trend higher; it has yet to confirm the loss of momentum suggested by monetary trends. Secondly, real narrow money expansion has rebounded strongly since the summer.
Real narrow money growth, indeed, appears to have reached its highest level since 2012 in January, based on data covering 60% of the G7 plus E7 aggregate. This mainly reflects an energy-driven plunge in inflation but, in addition, nominal money expansion appears to have increased significantly last month, reflecting a big rebound in Chinese M1 growth.
The latter surge, admittedly, is likely to be partly due to the late timing of the lunar New Year holiday. A reversal in Chinese M1 in February, however, may be offset by stronger growth in the US, based on monetary data for the first two weeks.
A fall in US real narrow money expansion last summer suggested that the economy would lose momentum in early 2015 – see second chart and post from September. This is playing out – the Citigroup US surprise index has moved deeper into negative territory – but monetary trends are now signalling economic reacceleration. Eurozone real money, meanwhile, is rising strongly and growth has picked up in Japan, with China probably now following. The global monetary backdrop, in other words, looks increasingly expansionary.


UK productivity stagnation extends
Inflationary risks from the UK labour market continue to increase. Today’s statistics show a further decline in labour availability, continued poor productivity performance and rising wage pressures.
The unemployment rate fell to 5.7% over October-December, the lowest since 2008 and down from 7.9% at the time of the last general election in May 2010. The short-term unemployment rate, measuring those out of work for six months or less, dropped to 2.8%, the lowest on record in data extending back to 1992 – see first chart. 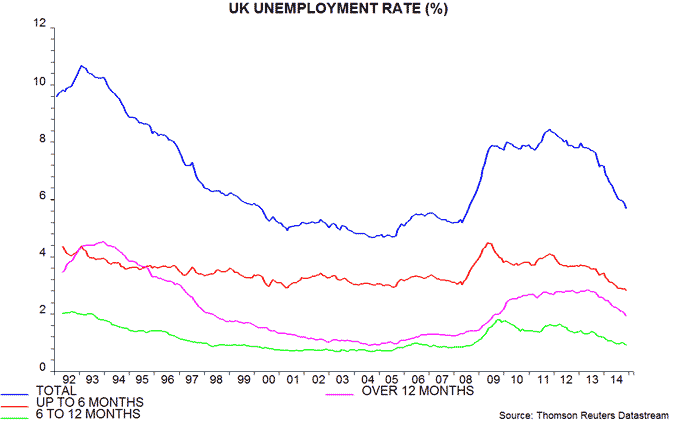
The more timely claimant count, meanwhile, dropped by a whopping 39k in January, suggesting that the overall unemployment rate will maintain its recent pace of decline of about 0.1 percentage point per month – the Bank of England, by contrast, expects a slower fall.
The implication of a growing labour shortage is supported by a further rise in the stock of unfilled vacancies to a record in data back to 2001.
The Bank of England last year claimed that rapid labour supply expansion would head off a shortage of workers. The labour force, however, expanded by only 0.4% in the year to the fourth quarter, well below the average annual growth rate of 0.9% since 2005 – second chart.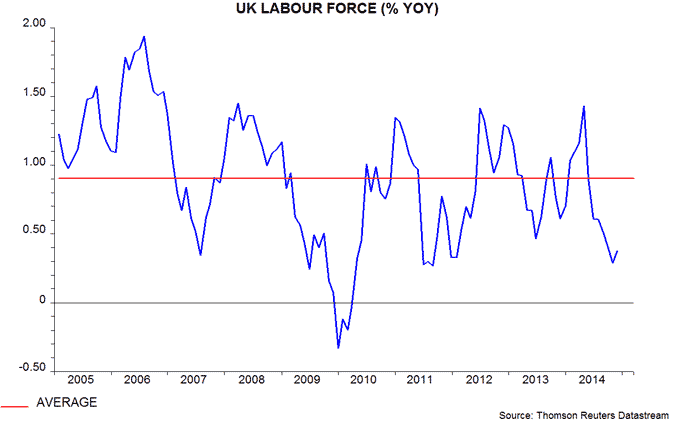
Bonus payments pushed up the annual growth rate of average weekly earnings to 2.4% in December but regular pay expansion eased back to 1.6% from 1.7% in November. Private regular earnings, however, increased at a 3.3% annualised rate between the third and fourth quarters, suggesting a pick-up in annual growth in early 2015 – third chart.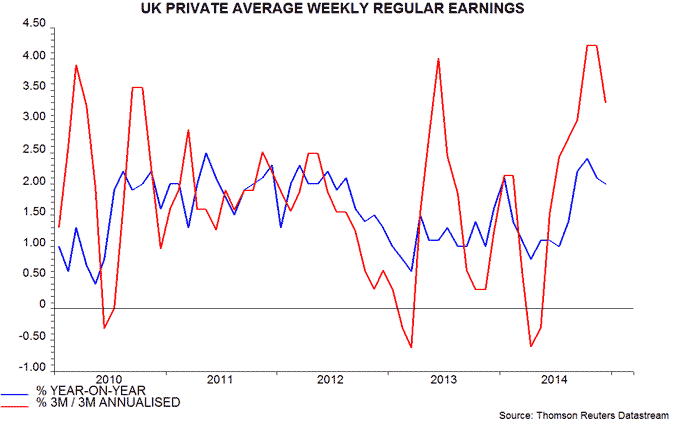
Productivity performance, meanwhile, remains dismal. Aggregate hours worked in the economy rose by 0.8% between the third and fourth quarters, exceeding the currently-estimated 0.5% rise in GDP. Flat productivity and a slow labour force rise suggest that trend GDP expansion is much weaker than implied by the Bank of England’s rosy forecast of strong medium-term growth coupled with sustained low inflation.
UK election model: Tory lift arriving too late?
A post in April last year described an economic model of UK voting intentions. This model suggested that the Conservatives would move into a 1-2 percentage point lead over Labour by the May 2015 general election, based on a plausible economic scenario. Updating the inputs, it continues to predict a 2 point Tory advantage by May but indicates that the gap would rise to 6 points by end-2015 in the absence of an election, as the economic backdrop continues to brighten. Conservative hopes of victory rest on persuading voters to give them credit for prospective as well as current good news.
The model is designed to predict the poll differential between the main government and opposition parties based on economic factors. It was estimated on ICM-Guardian poll data extending back to 1984. The poll differential depends positively on average earnings growth and house price inflation, and negatively on the unemployment rate, inflation and interest rates (Bank rate). More details are available in the previous post.
The Conservative-Labour differential swung from -3 percentage points in the January ICM-Guardian poll to +4 points in the February poll released this week. The model suggests that the latter result is an outlier and the “true” differential is currently -1 point – see chart. The Tories, however, are predicted to move into a 2 point lead by May, based on key assumptions that average earnings growth rises to 2.5% by then and consumer price inflation remains below 0.5%.
The problem for Conservative strategists is that the earnings pick-up may be occurring too late to swing the election result. The Bank of England expects earnings growth to rise further to 3.5% by late 2015. With inflation projected to remain low and unemployment to continue to decline, the Bank’s forecast implies that the Tory lead would widen to 6 points by end-2015 in the absence of an election, according to the model. A 6 point advantage in May would ensure a return to power.
The Conservatives are finally benefiting from an improving economy but their challenge is to convince voters that the recent recovery in real earnings is the start of a sustained upswing, for which they should receive electoral credit now.
