Entries from February 8, 2015 - February 14, 2015
UK Inflation Report: MPC fudges inflation implication of lower slack
Forecast changes in the February Inflation Report look internally inconsistent.
The MPC slashed its near-term inflation forecast to take account of recent commodity price weakness, with the annual CPI change now expected to fall to about zero in the second and third quarters of 2015. Surprisingly, it also lowered its medium-term projection: inflation in the first quarter of 2017, for example, is now forecast at 2.2% assuming unchanged policy, down from 2.4% in November.
The latter reduction is inconsistent with a significant downward revision to the MPC’s estimates of current and future spare capacity. Slack is estimated to be only about 0.5% of GDP at present, down from 1% in November, and is forecast to be eliminated within 18 months, versus two to three years previously.
Earlier elimination of spare capacity contributes to a stronger pick-up in average earnings growth, which reaches 3.5% and 4% in the fourth quarters of 2015 and 2016 respectively, a quarter-point higher than in November in both cases. With productivity assumptions little changed, unit labour cost growth climbs to 2% in late 2015 and 2.75% a year later.
Unit labour cost growth of 2.75% by late 2016 is incompatible with inflation remaining close to 2% in 2017, barring a major profits squeeze or further fall in import costs. The MPC may resolve this contradiction by raising its medium-term inflation forecast in May – after the general election.
Japanese money / wage trends signalling stronger economy
Japanese monetary trends remain strong, suggesting upside risk to the consensus forecast of 1.2% GDP growth in 2015.
The six-month change in M1, M2 and M3 peaked in late 2013 and fell sharply through July 2014. The real-terms change turned negative from April, when a rise in the sales tax from 5% to 8% boosted consumer prices by 2.1%*. This contraction was reflected in falls in GDP in the second and third quarters – see first chart.
Money measures, however, have rebounded strongly since July, while the sales tax hike dropped out of the six-month inflation rate in October. Six-month real money growth, therefore, is back at levels consistent with solid economic expansion. Industrial output rose by 1.7% between the third and fourth quarters while next week’s GDP release may report an increase of about 1%, or 4% annualised.
Also notable is a continued firming of wage trends, consistent with evidence of a tight labour market. Total cash earnings at firms with 30 or more employees rose by an annual 2.5% in December, reflecting a 3.4% increase in winter bonuses. More significantly, growth in scheduled earnings (i.e. excluding bonuses and overtime) climbed to 1.2%, a level matched or exceeded in only three months since 1997. With headline consumer price inflation on course to fall to zero in the spring as a result of oil and tax effects, annual real wage growth should soon be running at 1-2% – second chart.
*Bank of Japan estimate.
E7 industrial output above G7, reflecting China
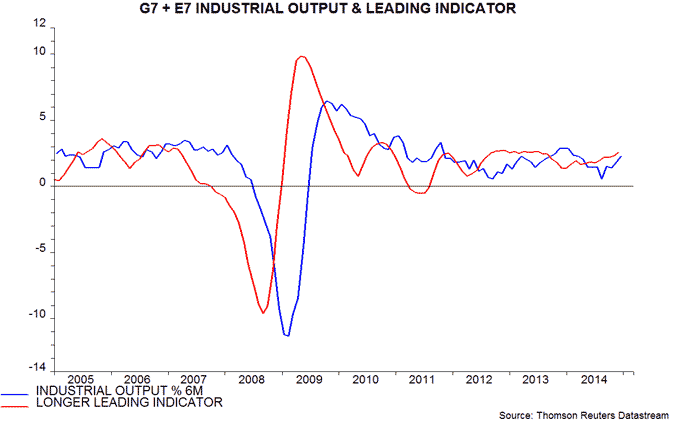
The global economy is dominated by the G7 countries and the seven largest emerging economies, or “E7”*. Six-month growth of industrial output in these fourteen economies rose to an estimated 2.3%, or 4.7% annualised, in December**. The longer leading indicator calculated here suggests that the recent upswing will extend through the first half of 2015, at least – see first chart.
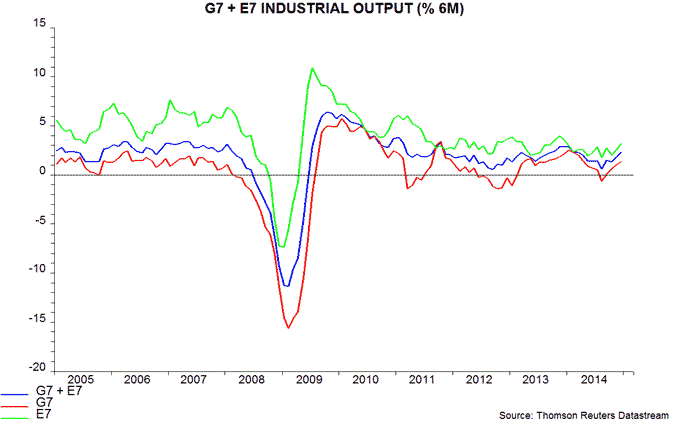
The recovery in G7 plus E7 growth from a low in August 2014 reflects stronger expansion in both groups. Growth remains significantly higher in the E7 than G7, although the current gap is below its average since 2010 – second chart.
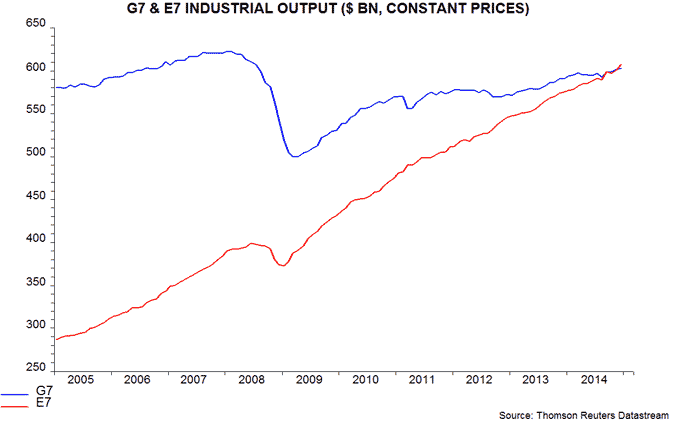
The G7 and E7 aggregates are calculated from World Bank country data on industrial output in constant (2005) US dollars. On this measurement, E7 industrial output now exceeds the G7 level. The ratio of E7 to G7 output has risen from 49% at the start of 2005 to 100% in September 2014 and 101% by December – third chart.
E7 / G7 convergence reflects enormous growth of industrial output in China. China now accounts for 62% of E7 output and 31% of the G7 plus E7 aggregate. The latter compares with 22% for the US. On the World Bank figures, Chinese industrial output surpassed the US level as long ago as 2009. Chinese output has risen by a cumulative 228% since January 2005 versus 34% for the rest of the E7 and only 4% for the G7.
*BRIC plus Korea, Indonesia and Mexico. The G7 plus E7 countries account for three-quarters of global industrial output, according to World Bank data.
**80% data coverage. December output is assumed to be unchanged from November for missing countries.

