Entries from December 7, 2014 - December 13, 2014
Japanese money trends signalling economic rebound
Japan’s economic outlook continues to improve, judging from further strong gains in monetary aggregates in November.
The six-month rate of change of M1, M2 and M3 peaked in late 2013 and fell sharply through July 2014. The real-terms change turned negative from April, when a rise in the sales tax from 5% to 8% boosted the consumer prices index by 2.1%*. This contraction was reflected in falls in GDP in the second and third quarters – see first chart.
All the Ms, however, have rebounded strongly since July, while the sales tax hike dropped out of the six-month inflation rate in October. Six-month real money growth, therefore, is back at levels consistent with solid economic expansion.
The slowdown and recovery in nominal money growth were unrelated to the Bank of Japan’s QE operations, which have proceeded steadily. The earlier weakness in broad money M3 was partly due to heavy sales of government bonds by banks and a worsening basic balance of payments, reflected in a fall in the banking system’s net foreign assets. Bond sales have slowed recently while net foreign assets have resumed growth.
Narrow money M1 is determined by demand for liquidity, usually for future spending purposes. The slowdown in early 2014 signalled that consumers and businesses were planning to cut spending after the sales tax rise, with the recent rebound suggesting returning confidence.
Six-month real M1 growth was much stronger in the US than Japan in early 2014, consistent with subsequent US economic and equity market outperformance. The tables have now turned, with the recent Japanese rebound coinciding with a slowdown in the US; the Eurozone, meanwhile, has moved to the top of the global ranking – second chart. Economic news is more likely to surprise positively in the Euroland and Japan than the US in early 2015.
*Bank of Japan estimate.


UK fiscal projections flattered by suspect output gap assumption
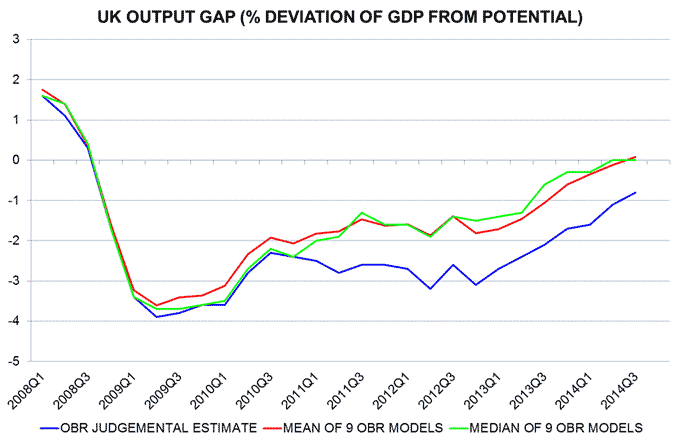
Last week’s fiscal forecasts from the Office for Budget Responsibility (OBR) assume that the “output gap” – i.e. the deviation of GDP from its “potential” level – was -0.8% in the third quarter of 2014. This assumption, however, looks optimistic relative to the OBR’s formal methods for estimating the gap. A neutral assumption, based on these methods, is that it has now closed. This would imply that the existing budget deficit is entirely structural while domestic inflation is likely to overshoot OBR and Bank of England forecasts.
The OBR uses nine separate methods for estimating the output gap, detailed in a recent working paper*. The current estimates from these methods range from -2.3% to +1.6%, demonstrating a very high degree of uncertainty. The OBR’s assessment that the true figure is -0.8% has received little critical attention. This is probably because -0.8% is close to the mid-point of the range and broadly agrees with the MPC consensus view that economic slack is currently about 1% of GDP.
The range mid-point, however, gives a misleading impression of the balance of evidence across the nine methods. Detailed results in a spreadsheet** of supplementary information on the OBR’s website show that six of the nine estimates are zero or positive. Only two suggest a negative output gap larger than -0.8%. The mean and median across the nine methods are +0.1% and zero respectively – see chart.
The OBR projects that public sector net borrowing will be 5.0% of GDP in 2014-15, of which 0.8 percentage points is attributable to the economy operating below capacity (i.e. cyclically-adjusted net borrowing is forecast to be 4.2% of GDP). If the true output gap is zero rather than -0.8%, there is an additional “structural” fiscal shortfall to be corrected of 0.8% of GDP, equivalent to £15 billion per annum.
A zero gap now, meanwhile, implies that it will turn significantly positive next year, based on OBR and Bank of England growth forecasts, pushing up domestic inflation. As previously noted, an upswing in domestic inflation is already under way, with the annual increase in the deflator for gross value added at a two-year high in the third quarter, based on preliminary data.
*Working Paper No. 5 by Jamie Murray, Output gap measurement: judgement and uncertainty.
**December 2014 Economic and Fiscal Outlook, Economy supplementary tables, table 1.18.

