Entries from November 9, 2014 - November 15, 2014
Global leading indicators still positive
 Simon Ward
 Post a Comment
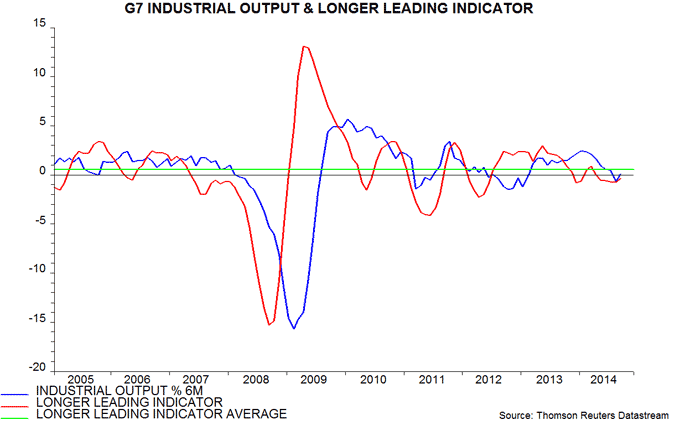
The global leading indicators followed here were little changed in September and remain consistent with a recovery in industrial output growth.
The indicators are based on the OECD’s country leading indicators but are designed to provide earlier warning of growth turning points. The short leading indicator typically leads turning points in six-month global industrial output growth by 2-3 months and the longer leading indicator by 4-5 months.
The longer leading indicator reached a trough in December 2013, with the shorter version following in February 2014. This suggested that global industrial output growth would recover from mid-2014. Weakness, in fact, extended through August, partly reflecting the impact of Japan’s April sales tax rise – see previous post. Output growth rebounded to its June level in September, however – see first chart.
The short leading indicator was stable in September at its highest level since November 2013, while the longer version edged down. Based on the average lead times, this suggests that global industrial output growth will recover further during the fourth quarter but will level off around year-end. With the recent growth trough occurring later than expected, however, the next peak could be correspondingly delayed.
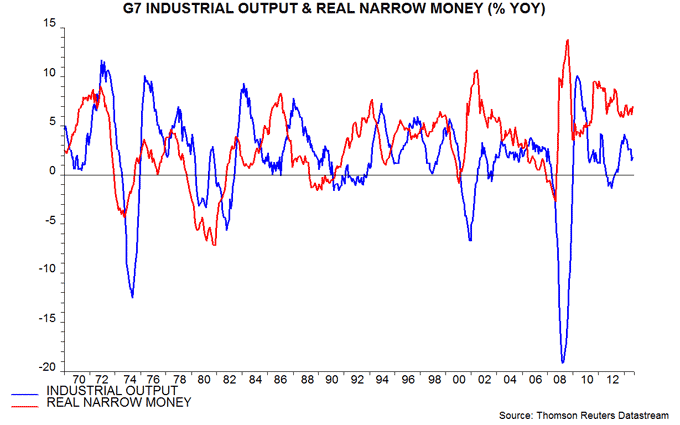
Global real narrow money trends are consistent with a moderation in output growth from early 2015 – see previous post.
Within the global aggregate, the Eurozone longer leading indicator continued to recover in September, supporting the positive message from recent stronger real narrow money expansion – second chart.


UK earnings pick-up overshadows Inflation Report
A September post suggested that UK average earnings growth was about to rise significantly, based on the historical relationship with job openings (vacancies). The annual increase in whole-economy average weekly regular earnings was then 0.8%, referring to July, but has since firmed to 1.8% in September. Earnings rose at an annualised rate of 3.0% between the second and third quarters – see first chart.
The acceleration has been driven by the private sector. Private regular earnings grew by 2.3% in the 12 months to September and by 3.1% annualised between the second and third quarters.
The quarterly rise in hourly earnings was larger than in weekly earnings, because average weekly hours worked fell from 32.2 to 32.1 between the latest two quarters.
Monetary policy doves will argue that the earnings pick-up reflects stronger labour productivity: GDP is currently estimated to have risen by 0.7% (not annualised) last quarter, while aggregate hours worked in the economy fell by 0.1%. Productivity, however, was stagnant between the third quarter of 2013 and the second quarter of 2014 – the trend, therefore, is still weak.
The rise in earnings growth is viewed here as the consequence of an increasingly tight labour market. The job openings rate (i.e. vacancies as a percentage of filled and unfilled jobs) rose further in the three months to October and is now close to its 2008 peak – second chart*. Earnings growth has started to pick up nine quarters after the openings rate embarked on a sustained increase in the second quarter of 2012. This is consistent with the average lag at major earnings growth lows in the 1970s and 1980s – see the earlier post for details.
Stronger earnings growth validates the concerns of the two MPC hawks, Ian McCafferty and Martin Weale, but they have no support from the rest of the Committee, judging from the resolutely dovish tone of today’s Inflation Report. The mean forecast of inflation in two years’ time based on unchanged policy was cut to 2.26% from 2.52% in August, signalling that the MPC consensus expects a much later and / or smaller rise in interest rates.
*Quarterly averages except for last data points, which are latest available.


Japanese money trends strengthening before QE boost
Japanese monetary growth continued to pick up in October, suggesting an improving economic outlook and questioning the necessity of the Bank of Japan’s latest QE expansion.
As previously discussed, six-month growth of all the published aggregates slumped during the first half of 2014, warning that economic weakness following the April sales tax increase would be greater than the consensus expected. Money growth, however, has staged a V-shaped rebound since July – see first chart.
The real-terms turnaround has been larger, with the six-month rise in consumer prices, seasonally adjusted, falling sharply in October as the sales tax effect dropped out. Real money trends are signalling a return to solid economic expansion by early 2015 – second chart.
US real narrow money growth surged from late 2013 even as Japanese growth turned down, suggesting that the US economy and equities would outperform. The US / Japanese real money growth gap has narrowed sharply since mid-year, almost closing in October* – third chart.
*October partly estimated.


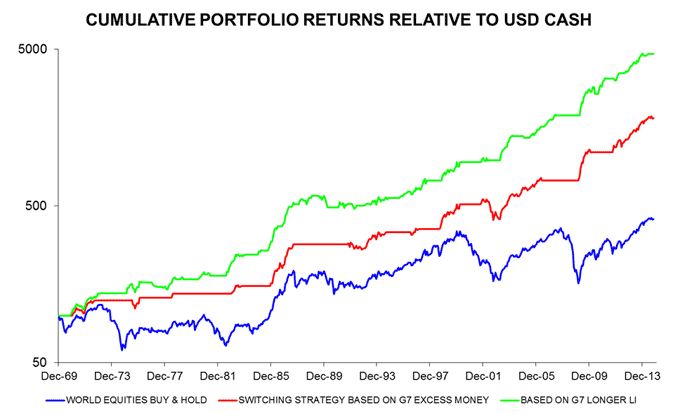
Equities versus cash investment rules: an update
Previous posts have described two simple investment rules for switching between global equities and US dollar cash. As detailed below, one of the rules is positive on equities while the other prefers cash.
The first rule holds equities or cash depending on whether G7 annual real narrow money supply expansion is higher or lower than industrial output growth. A faster rise in money holdings than output suggests that investors are about to deploy cash in asset markets, pushing up prices. Conversely, a slowdown of money relative to output may signal a deteriorating liquidity backdrop for equities. An investor following this rule over the last 30 plus years would have captured much of the rise in equities while largely avoiding bear markets. The rule outperformed a strategy of buy and hold by 3.5% per annum (pa) between 1969 and 2013 – see first chart*.
The second rule switches between equities and cash depending on whether the G7 longer leading indicator followed here is above or below its long-run average. The indicator is designed to predict turning points in industrial output growth: a rise through the average signals economic acceleration; a fall below it warns of a slowdown. The backtest performance of the rule is superior to that of the excess money rule; it captures more of the rise in equities and avoids a larger proportion of the bear phases. The rule outperformed buy and hold by 6.0% pa over 1969-2013 – first chart.
These returns are hypothetical because they are based on currently-available data. The excess money results, however, may be realistic, since annual real money and industrial output growth could have been calculated in real time and subsequent data revisions would probably have made little difference to the timing of cross-over signals. By contrast, the leading indicator series incorporates changes over the years in the construction and constituents of the OECD’s country leading indices. Data revisions to these indices, moreover, are sometimes significant. The historical return of the leading indicator rule, therefore, is unlikely to have been achievable in practice.
G7 annual real narrow money expansion has been above industrial output growth since 2011 and the current gap is the widest since August 2013 – second chart. The first rule, therefore continues to favour equities.
The G7 longer leading indicator, by contrast, has been below its long-run average since April, resulting in the second rule being in cash since June** – third chart. The indicator, however, recovered in September, suggesting that the trend is turning.
The rules, it should be noted, are intended to capture the bulk of gains during market upswings while limiting losses during downswings – they rarely signal the exact top of a bull run or bottom of a bear market.
*A six-month lag is applied before buying equities after a positive cross-over.
**Allowing for the release lag.