Entries from October 26, 2014 - November 1, 2014
UK money trends suggesting steady growth
UK monetary trends remain solid, casting doubt on forecasts of an imminent economic slowdown – the consensus projection is for GDP growth to fall from 3.1% in 2014 to 2.6% in 2015, according to the Treasury’s monthly survey.
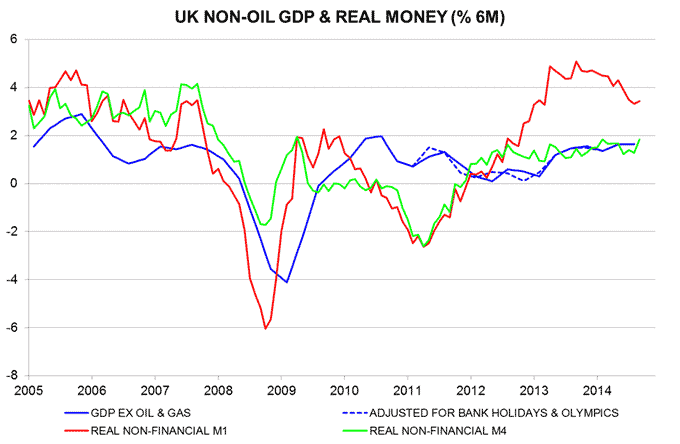
The preferred narrow and broad aggregates here are M1 and M4 excluding financial sector deposits*. Six-month growth of real non-financial M1 has moderated since end-2013 but remains strong by historical standards. Real non-financial M4 expansion returned to the top of its recent range last month – see first chart.
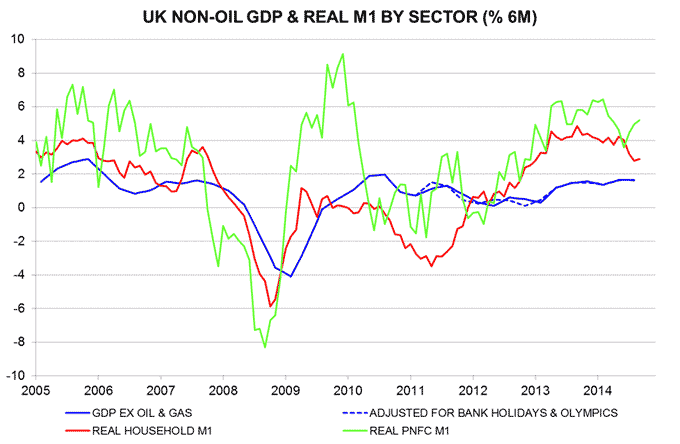
The second chart shows a breakdown of real non-financial M1 growth between households and private non-financial corporations (PNFCs). Real PNFC M1, in particular, has given good forecasting signals in recent years: for example, its six-month change turned negative in late 2007 ahead of the 2008-09 recession and dropped sharply in 2010 ahead of the 2011-12 “double dip” scare. Growth has rebounded after a modest decline in early 2014, suggesting solid prospects for business investment and hiring.
*Financial sector deposits are volatile and contain less information about near-term economic prospects.


Why UK monetary policy is still loosening
UK Bank rate has remained extraordinarily low for more than five years for two fundamental reasons. First, sustained loose monetary policy has been needed to offset various drags on economic growth. Secondly, the spread between commercial bank interest rates and Bank rate has been much wider than in the past, requiring the latter to be set much lower to achieve a given policy stance.
The second reason is usually ignored in policy discussions but is as important as the first for assessing whether a change is needed. As banks return to financial health, the spread between their interest rates and Bank rate is falling. By keeping Bank rate unchanged, the MPC has acceded to an effective further loosening of monetary policy.
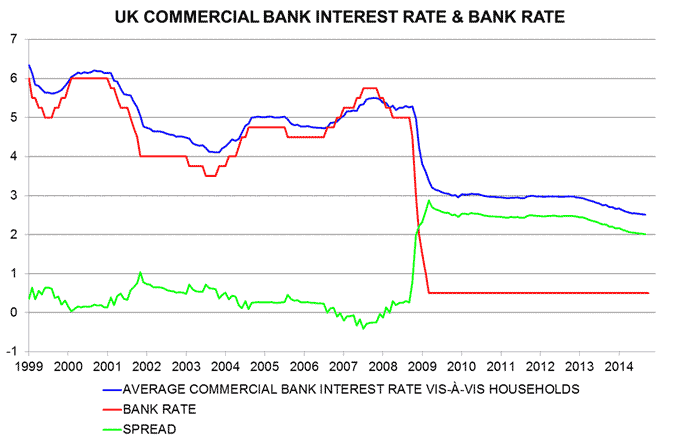
The first chart compares the average commercial bank interest rate vis-à-vis households* with Bank rate. This average rate has fallen by 0.4 percentage points since end-2012. It is reasonable to argue that the policy stance was sufficiently loose at end-2012, since economic growth in 2013-14 has been strongly above trend. On this view, the MPC should have raised Bank rate to keep the average commercial bank rate stable and avoid unwarranted further stimulus.
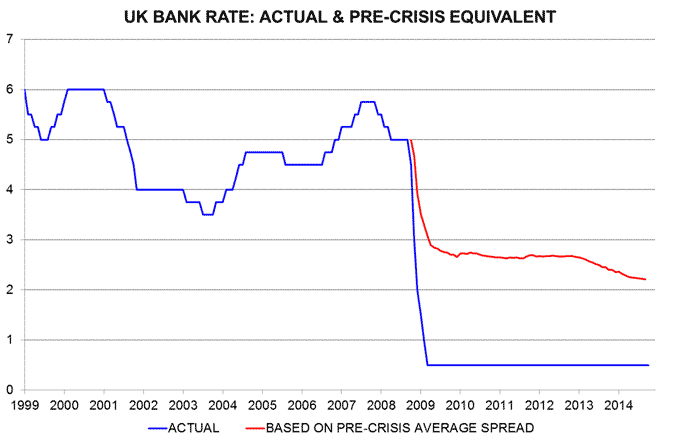
The second chart makes the same point in a different way. The red line shows a “pre-crisis equivalent” Bank rate – an estimate of the level that would have been required before 2009 to produce the observed commercial bank interest rate, based on the pre-crisis average spread. This equivalent rate was stable at 2.6-2.7% over 2010-12 but has since fallen to 2.2%. The MPC, arguably, should have raised Bank rate to prevent this decline.
Put aside the discussion about whether it is time to begin scaling back monetary stimulus. The relevant question for the MPC’s doves is why they believe the policy stance now should be even looser than at end-2012.
*Average of lending and deposit rates, calculated from Bank of England interest rate and volume data for different types of business.


Eurozone money trends also signalling improving outlook
Eurozone money measures grew solidly again in September, suggesting improving economic prospects and initial success for the ECB’s recent easing measures.
Narrow money M1 has risen by 2.5%, or 10.3% annualised, since June, when the ECB cut its main refinancing and deposit rates by 10 basis points (bp), the latter to a negative level. Broad money M3 has increased by 1.3%, or 5.4% annualised, over the same period. The ECB lowered rates by a further 10 bp in September.
The monetary pick-up casts strong doubt on the IMF’s recent estimate of a 40% chance of a recession by mid-2015. The six-month change in real (i.e inflation-adjusted) M1 turned negative ahead of the 2008-09 and 2011-12 recessions; it is currently the strongest since late 2012, ahead of the 2013 economic recovery – see first chart.
Six-month real M3 growth, meanwhile, is the highest since 2009. (Real M3, however, is less reliable than M1 as a leading indicator, failing, for example, to signal the 2008-09 recession in advance.)
Stronger real money trends reflect a rise in nominal expansion rather than lower inflation. The six-month change in consumer prices, seasonally adjusted, has recovered since the spring, though remains weak – second chart.
Monetary acceleration undermines the popular narrative that the ECB is “behind the curve” and must embrace full QE including sovereign bond purchases to head off deflation. The ECB’s rate cuts, indeed, appear to have been more effective in stimulating monetary growth than the Bank of Japan’s ultra-aggressive QE programme. As previously discussed, Japanese QE has, until recently, involved commercial banks swapping bonds for central bank reserves, with no impact on the money holdings of households and non-financial firms. Japanese M3 rose by 3.2% annualised in the three months to September versus 5.4% growth in the Eurozone.
The ECB publishes a country breakdown of overnight deposits, comprising about 80% of Eurozone M1. Six-month real deposit growth remains higher in the periphery than the core, suggesting superior economic and equity market prospects – third chart. Trends are strongest in Portugal and Spain but Italy is outperforming Germany and France – fourth chart.


