Entries from August 24, 2014 - August 30, 2014
Eurozone / UK core inflation defying "deflationistas"
The “monetarist” rule-of-thumb that money supply changes lead domestic prices by roughly two years suggested that Eurozone and UK “core” inflation would bottom around end-2013 and revive during 2014. Recent news is consistent with this forecast, although the rise to date has been small.
Eurozone core inflation, as measured by the annual rate of change of consumer prices excluding energy, food, alcohol and tobacco, fell from 1.5% at end-2012 to 0.7% at end-2013. It revisited this level in March and June but edged up to 0.9% in August, according to today’s “flash” estimate – see first chart.
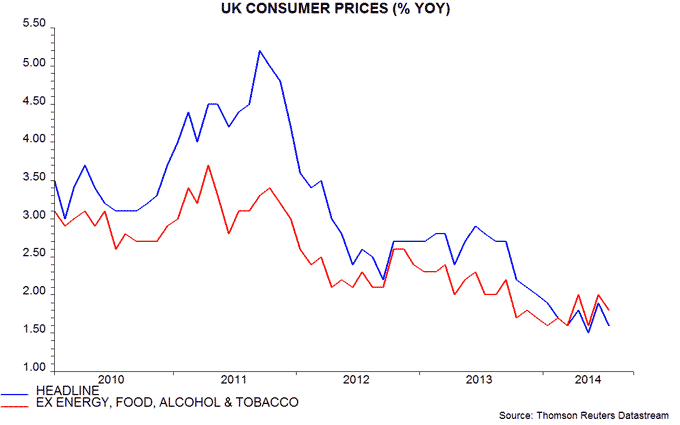
UK core inflation declined from 2.4% at end-2012 to a low of 1.6% in January 2014 but was 1.8% as of July – second chart.
The change of trend around end-2013 fits with a turnaround in monetary growth in 2011-12. Annual narrow money expansion bottomed in July 2011 in the Eurozone and June 2011 in the UK but a significant recovery was delayed until 2012.
Core inflation has been temporarily restrained by exchange rate strength. The euro effective rate rose by 6.5% during 2013, though has fallen by 3.4% year-to-date. The sterling effective rate climbed 1.7% last year and is up a further 3.0% so far in 2014.
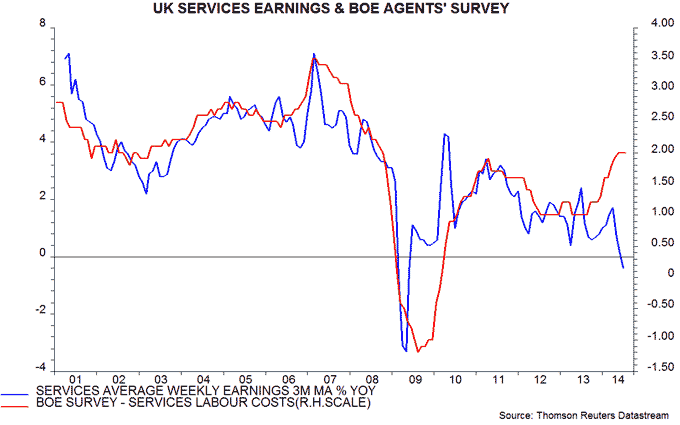
UK core inflation is expected here to rise significantly by mid-2015, reflecting a strong increase in money growth through mid-2013 and subsequent economic buoyancy. Services inflation should lead the upward move: the net percentage of consumer services firms planning to raise prices is the highest since 2011, while pay pressures are increasing – third and fourth charts.


Eurozone money numbers better, early QE unlikely
Eurozone monetary trends strengthened further in July, suggesting that recent ECB policy easing is bearing fruit and will lead to an economic revival later in 2014, barring external “shocks”.
Six-month growth of real (i.e. inflation-adjusted) narrow money M1 has risen from 1.6% (not annualised) in April to 2.5% in July, a solid pace by historical standards. Real M3 expansion has recovered from 0.1% to 1.1% over the same period, the latter reading being the highest since late 2012, ahead of a return to economic growth in 2013 – see first chart.
Nominal money trends have firmed notably in the latest three months, partly reflecting the ECB’s June rate cut and the announcement effect of its targeted long-term refinancing operations (TLTROs), the first of which will be allotted on 18 September. M1 and M3 rose at annualised rates of 7.3% and 5.7% respectively between April and July.
Faster M3 growth has been driven by a further rise in the balance of payments surplus*, larger outflows from longer-term bank savings into deposits as a result of falling interest rates and a slower contraction of private sector credit.
The forecasting approach here emphasises M1 because of its closer link to spending intentions and historically superior leading indicator properties. The ECB publishes a country breakdown of overnight deposits, which comprise 83% of Eurozone M1. Six-month real overnight deposit growth is strong in Spain and – surprisingly – France, while remaining solid in Italy and Germany. Dutch weakness, however, has intensified – second chart.
In other news today, the net percentage of Eurozone consumers expecting prices to rise over the next 12 months slipped from +9% in July to +7% in August but remains broadly consistent with the ECB’s inflation target, based on history – third chart.
ECB President Draghi’s Jackson Hole speech signalled that further easing measures, including full QE, are under consideration but better monetary news and the forthcoming TLTRO suggest that a decision on action will be deferred until October at the earliest.
*Basic balance, i.e. current account plus direct / portfolio investment flows.


US stock market rise stretched relative to history - update
This post updates a comparison of the rise in the Dow Jones Industrials index from its March 2009 low with increases after six previous bear markets involving a peak-to-trough fall of about 50%. (The Dow declined by 54% between October 2007 and March 2009.) As explained below, the current level of the Dow is slightly above the top of the range spanned by these prior rises.
The six bear market troughs considered in this analysis occurred in November 1903, November 1907, December 1914, August 1921, April 1942 and December 1974. The Dow Industrials fell by between 45% and 52% into these lows. (The 1929-32 bear market was excluded because it involved a much larger decline, of 89%.) In each of the six cases, the trough of the bear market was rebased and shifted forwards in time to align with the March 2009 low. The subsequent rises were then traced out and an average calculated – see chart.
The current rise broadly tracked the “six-recovery average” until late 2011 but has since diverged positively, standing 39% higher as of yesterday’s close. The average remains below the current Dow level through end-2019.
The Dow is 4% above the top of the range spanned by the prior rises. The range top is defined by the “roaring twenties” increase from the August 1921 trough – black line in chart. The equivalent month to August 2014 was March 1927. If the Dow were to replicate its performance then, it would rise to 18,000 at end-2014 and 22,000 at end-2015 en route to a peak of 39,000 in January 2017, corresponding to September 1929.
As noted, the 1929-32 bear market wiped out 89% of the Dow’s peak value, returning it to the equivalent today of 4,000.
The historical analysis, therefore, suggests that the Dow will trade significantly below its current level at some point over the next five years. A further substantial rise first, however, cannot be ruled out.
The “monetarist” perspective here is that bear markets are normally triggered by money supply expansion falling short of the needs of the economy – such a shortfall crimps future activity and is associated with a withdrawal of liquidity from markets. Annual real narrow money growth moved well beneath industrial output expansion from late 1928, signalling a deteriorating liquidity backdrop. The real narrow money / industrial output growth gap remains positive currently, both in the US and globally.
UK MPC minutes suggest increased interest in money trends
An interesting feature of the August MPC minutes is that the “Money, credit, demand and output” section includes, for once, a discussion of monetary trends. This may reflect the influence of the Bank of England’s new chief economist, Andrew Haldane.
The discussion is relatively extensive and implies that monetary trends are consistent with continued strong economic growth, in line with the assessment here. In particular, it is suggested that households hold “excess” broad money balances that will be spent, while rapid expansion of corporate deposits supports optimism about business investment. There is also an indirect reference to narrow money buoyancy in an observation about households switching from time to sight deposits.
Mr Haldane was co-author of a 1995 Bank of England working paper Money as an Indicator, which found “strong and significant effects from narrow money through to nominal GDP and, in particular, prices”. As the paper noted, this matched a much earlier (1970) Bank study by Andrew Crockett, which concluded that “the money stock, narrowly defined (M1), seems to be positively related to subsequent changes in expenditure”.
If the above interpretation is correct, Mr Haldane will be placing significant weight on monetary trends and, if current strength continues, is likely to shift into the interest-rate-rise camp. (July monetary statistics are released on 1 September.)

