Entries from August 3, 2014 - August 9, 2014
Cycle analysis suggests 2016-17 US recession risk
A post last week suggested that economic fluctuations in recent decades can be explained by the interaction of three cycles. The current post applies this idea to post-WW2 US economic data.
The three cycles of interest are: the 3-5 year Kitchin stockbuilding cycle; the 7-11 year Juglar business investment cycle; and the 15-25 year Kuznets housebuilding cycle.
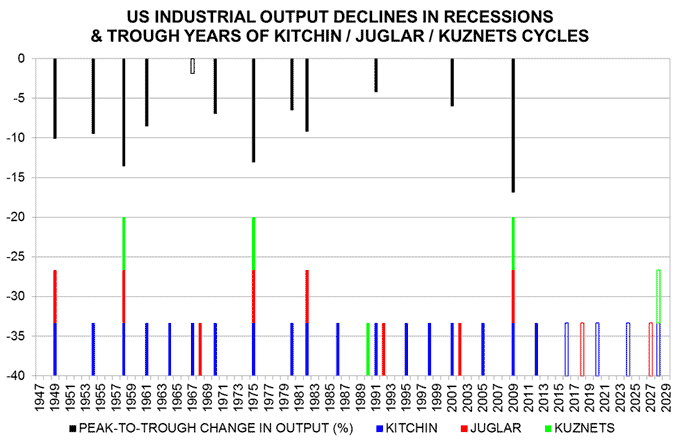
The upper part of the first chart shows the peak-to-trough declines in US industrial output in the 11 post-war recessions identified by the National Bureau of Economic Research (solid bars). Each decline is plotted in the year in which the recession trough occurred, e.g. the 2008-09 fall is plotted in 2009. A fall in output in 1966-67 is also included (outline bar), although the associated economic downswing did not qualify as a recession.
The lower part of the chart shows the trough years of the Kitchin, Juglar and Kuznets cycles. These troughs were identified judgementally by examining detrended national accounts data on stockbuilding, business investment and residential investment. Possible dates of future cycle troughs are also shown (outline bars).

This exercise yields the following insights.
First, as suggested in the earlier post, severe recessions occur when the three cycles reach a trough in the same year. There were three such years – 1958, 1975 and 2009. Industrial output declined by 14%, 13% and 17% respectively.
There was the potential for another synchronised trough in 1990-92. In the event, the three cycles bottomed a year apart. The associated recession was mild, measured in terms of the peak-to-trough industrial output. Economic weakness, however, was extended.
Secondly, years in which Kitchin and Juglar cycle troughs coincide are associated with “average” recessions. There were two such years – 1949 and 1982. Industrial output declined by 10% and 9% respectively.
There was the potential for synchronised Kitchin / Juglar troughs in 1967-68 and 2001-02 but, again, the cycles bottomed a year apart, so a recession was avoided in the former case and was mild in 2001.
Thirdly, Kitchin cycle troughs, in isolation, are not usually associated with recessions. There were 10 years in which the Kitchin cycle bottomed more than a year apart from the other two cycles. Recessions occurred in four of those years – 1954, 1961, 1970 and 1980. The 1954, 1970 and 1980 recessions were partly the result of “shocks” – significant fiscal tightening, a prolonged auto workers’ strike and the imposition of credit controls respectively.
The last Kitchin cycle trough occurred in 2012. There was no recession but economic weakness resulted in the Federal Reserve launching open-ended QE.
What are the implications for the timing of the next recession? The 3-5 year Kitchin cycle is scheduled to reach another trough between 2015 and 2017, while the 7-11 year Juglar cycle should bottom between 2016 and 2020. If the Kitchin trough is late and / or the Juglar trough arrives early, the cycles may synchronise, resulting in a recession. The most likely years for a recession to occur are 2016 and 2017, since the Kitchin cycle will embark on another upswing by 2018.
Note that these timings relate to cycle troughs. A 2016 recession trough would imply economic weakness beginning in 2015.
Monetary policy will affect the outcome. The Federal Reserve plans to raise interest rates gradually by about 2 percentage points between end-2014 and end-2016. This suggests a maximum negative impact on the economy in 2016-17, coinciding with cyclical vulnerability. Fed policy, that is, could deepen the Kitchin trough and bring forward the Juglar downswing, thereby increasing the risk of a recession.
If the Fed believes that a higher level of interest rates is necessary for medium-term inflation control reasons, there is a case for it making the adjustment by mid-2015 at the latest, while the Kitchin cycle is still in an upswing.
Any recession in 2016-17 should be of average or mild severity, since the 15-25 year Kuznets cycle is not scheduled to reach another trough until 2024 at the earliest.
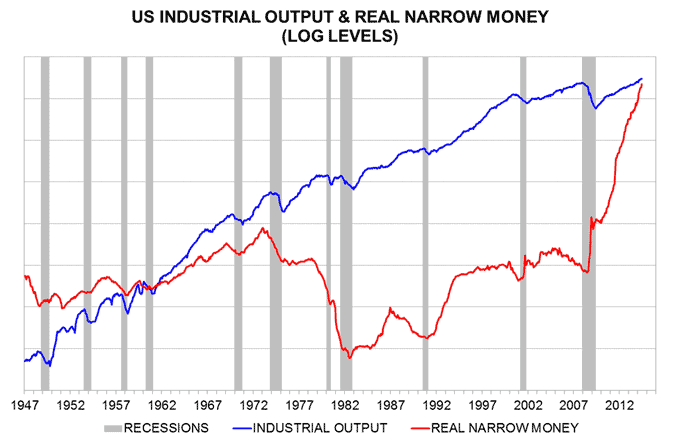
How should recession risk be monitored? As discussed in a post in 2010, real narrow money contracted before 10 out the 11 post-WW2 recessions, the exception being the 1954 downturn, which – as noted earlier – had a large fiscal element*. Real narrow money is currently rising strongly, consistent with recent faster economic growth being sustained into early 2015, at least – second chart.
*Real government spending fell by 6.4% between 1953 and 1954.

UK deposit rate fall boosting banks / economy
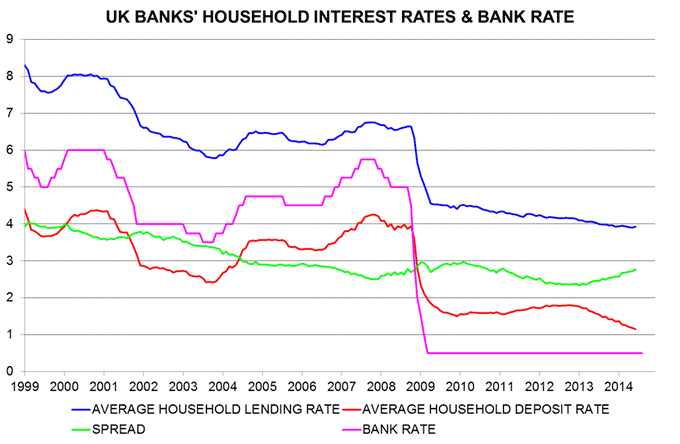
The average interest rate on the stock of UK bank lending to households rose marginally from 3.91% in May to 3.93% in June, while the average rate on household deposits eased from 1.19% to 1.15%* – see first chart. The lending / deposit rate spread, therefore, widened to 2.77 percentage points – the largest since February 2011.
While the lending rate has stabilised recently, it has fallen since late 2012; the deposit rate, however, has declined by more. The combined household interest rate, i.e. an average of the lending and deposit rates, is 0.42 percentage points (pp) lower than at end-2012 – second chart. The level of the combined rate at end-2012 was sufficiently stimulatory to generate strong growth and a rapid erosion of economic slack in 2013. The fall since then represents an unwarranted additional loosening of monetary conditions – see previous post for more discussion.
The further decline in the deposit rate has contributed to continued rapid narrow money expansion. Non-financial M1** rose by 5.1% in the six months to June, or 10.4% annualised – third chart. Narrow money correctly signalled economic strength in 2013 and the first half of 2014; current buoyancy suggests that growth will remain robust and may even rise further during the second half, contrary to MPC and consensus expectations.
*Lending / deposit rates on outstanding stocks estimated from Bank of England rate / volume data for different types of business.
**Notes / coin and sterling sight deposits held by households and private non-financial corporations.


Global money trends still positive
Six-month growth of global* real narrow money – the key forecasting indicator followed here – remained solid in June, suggesting respectable economic prospects through end-2014.
Real narrow money growth bottomed in November 2013, rising significantly through February / March 2014. Allowing for the typical half-year lead, this signalled that six-month industrial output expansion would rebound from a trough to be reached in spring 2014, probably May. Output growth may have ticked higher in June – see first chart**.
The summer growth rebound scenario is supported by the latest purchasing managers’ surveys and equity analysts’ earnings revisions. The G7 PMI manufacturing new orders index rose for a third successive month in July, while the earnings revisions ratio*** reached its highest level since 2011 – second chart.
Real narrow money growth fell slightly in April / May but stabilised in June and is still well above the November 2013 low. The message is that industrial output expansion may peak at the end of the current quarter but should remain solid in late 2014 – first chart. This assessment is expected to be confirmed by June leading indicator data to be released on Monday 11 August.
The current significant gap between real narrow money and output growth suggests a supportive liquidity backdrop for markets.
The small decline in real narrow money expansion since March reflects a rise in six-month inflation rather than any slowdown in nominal monetary trends – third chart. This inflation increase should partially reverse during the second half of 2014, assuming that commodity prices are stable at recent levels**** – fourth chart.
Real broad money is growing less quickly than the narrow measure emphasized here but is not giving a negative economic signal – fifth chart. Broad money has been less reliable for forecasting purposes in recent years and over the longer term – see previous post for more discussion.
*G7 developed plus E7 emerging economies.
**The June estimate in the chart incorporates actual data for the US, Japan, Brazil, China, Korea, Russia and Taiwan and an assumption that Eurozone and UK output reversed May declines.
***Upgrades minus downgrades as a proportion of the total number of analyst estimates.
****The impact of the Japanese sales tax rise will drop out of the six-month comparison in October.


