Entries from April 20, 2014 - April 26, 2014
UK MPC preview: "MPC-ometer" suggesting hawkish shift
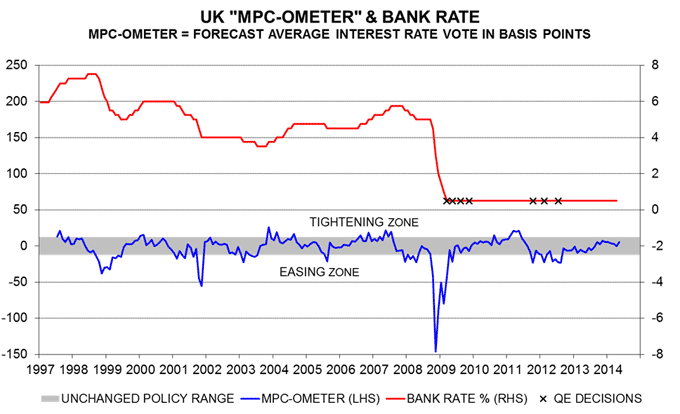
The uneasy truce on the MPC may break down in May, with one or more members expressing support for an early interest rate rise, according to the “MPC-ometer” model followed here.
The MPC-ometer is designed to forecast the “average interest rate vote” of Committee members based on a small number of economic and financial inputs relevant for assessing the outlook for growth and inflation*. Estimated in 2006, the model proved useful for predicting interest rate changes in the late 2000s; it also signalled the expansions of QE in 2011 and 2012**.
The preliminary model reading for May is +5 basis points, formally consistent with two votes for a quarter-point rate hike and seven for no change. The preliminary reading assumes that April PMI and consumer survey results are equal to February / March averages, while the “flash” first-quarter GDP report released on 29 April shows quarterly growth of 1.0%.
With the unemployment rate below 7.0%, MPC members are no longer shackled by the original forward guidance framework. The MPC-ometer reading was negative, signalling an easing bias, when the framework was introduced in August. It turned significantly positive in late 2013 but fell back through April, partly reflecting lower inflation expectations. The May reading, if confirmed, would be the highest since January.
Forward guidance may actually have harmed transparency by limiting MPC members’ ability to communicate how their views have shifted in response to much stronger-than-expected GDP and labour market performance. The May meeting is the hawks’ chance to escape the dove cote. Governor Carney faces a challenge in controlling dissent and convincing markets that forward guidance mark 2 will prove any more durable than its ill-judged predecessor.
*The inputs include GDP growth, business and consumer survey responses about future activity and prices, average earnings growth, changes in share prices and the exchange rate, and credit spreads.
**The model was modified in 2009 to incorporate QE, with the relevant parameter implying that £75 billion of gilt-buying is the policy equivalent of a quarter-point rate cut.

UK vacancies / short-term unemployed signalling stronger wages
Last week’s UK employment report casts further doubt on the Bank of England’s claim that there is still significant disinflationary slack in the labour market.
First, the vacancy rate, i.e. the stock of unfilled openings expressed as a percentage of the number of employee jobs, rose to a six-year high of 2.2% in the three months to March and is above its 2.0% average since 1995*. If the supply of labour were unusually high relative to demand, employers would fill openings rapidly and the vacancy rate would remain low.
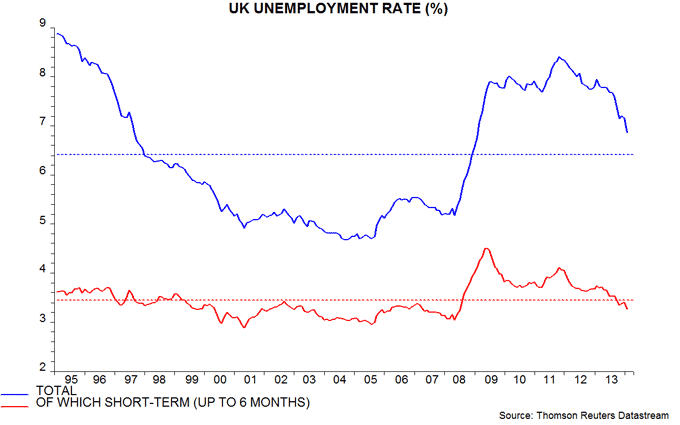
Secondly, the short-term unemployment rate, i.e. the number unemployed for six months or less expressed as a percentage of the labour force, fell to a six-year low of 3.3% over December-February and is below its 3.5% average since 1995 – see first chart. This suggests that job losers and people entering the labour force are finding work relatively swiftly – consistent with the message of strong demand from the vacancy rate. The current 3.3% rate is close to the 3.2% level reached before the start of the last interest rate upswing in November 2003.
The still-elevated overall unemployment rate – 6.9% versus a post-1995 average of 6.4% – reflects a higher-than-normal proportion out of work for more than 12 months. Some of these people may lack skills or motivation, or be discriminated against by employers, resulting in them having less influence on wage-setting.
The longer-term unemployed, and part-timers wanting additional hours, represent “slack” in the widest sense but the issue for the Bank is whether this would be taken up only in a boom scenario involving unacceptable wage and price pressures.
The suggestion that the vacancy and short-term unemployment rates are more important for pay trends and the inflation outlook is supported by correlation analysis and US research. The post-1995 correlation coefficients of average earnings growth with 1) the vacancy rate, 2) the short-term unemployment rate and 3) the over-12-month unemployment rate are 0.60, 0.72 and 0.43 respectively**.
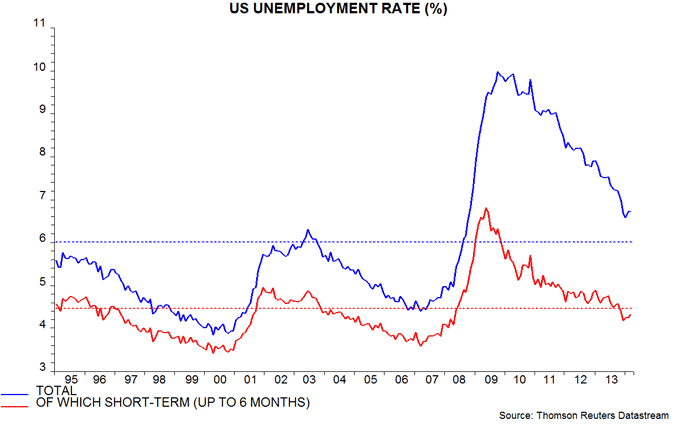
In the US, Robert Gordon of Northwestern University has demonstrated that an inflation model using the short-term rather than total unemployment rate has produced superior forecasts in recent years – the total rate model predicted, incorrectly, that inflation*** would fall below 0.5% in 2012-13. The current US short-term unemployment rate, like its UK counterpart, is beneath its post-1995 average – second chart. The US vacancy rate, meanwhile, is also at a six-year high.
The Fed and Bank of England are “exploring” whether remaining labour market slack is disinflationary by waiting for a pick-up in wage pressures before adjusting policy. Labour costs, however, generally move with prices rather than before, so this strategy implies a high risk of acting too late to prevent an inflation overshoot.
*The vacancy rate was estimated before April 2001 by linking the current employer-survey-based vacancies series with an earlier series covering vacancies at job centres.
**Positive correlation with vacancy rate, negative with unemployment rates.
***Quarterly change in personal consumption deflator, annualised.


