
Entries from April 13, 2014 - April 19, 2014
UK economics-based election predictor suggests hung parliament
 Simon Ward
 Post a Comment
An analysis of economic influences on political popularity suggests that the Conservatives will move ahead of Labour in the polls by the time of the May 2015 general election but their lead will be insufficient to deliver a majority in the House of Commons, and may not even result in the party holding the most seats in a hung parliament.
Statistical analysis of Guardian-ICM poll results since 1984 shows that the voting intentions differential between the main governing and opposition parties depends positively on average earnings growth and house price inflation, and negatively on the unemployment rate, retail price inflation and interest rates (Bank rate). The table reports the estimated sensitivities of the differential (i.e. Conservatives minus Labour currently) to these factors. A rise in headline average earnings growth, for example, from the current 1.7% to 2.7% would boost the Conservatives relative to Labour by 4 percentage points. An increase in Bank rate from 0.5% to 1.5% would have the opposite effect.
| Impact on Conservative-Labour differential of 1 percentage point rise in: | |
| Average earnings growth | +4 |
| Unemployment rate | -1 |
| Retail price inflation | -2 |
| House price inflation | +0.5 |
| Bank rate | -4 |
The model from which these sensitivities are derived also allows for “honeymoon” effects enjoyed by newly-elected governments – larger when the election results in a change of control – and a similar goodwill boost when there is a mid-term change of prime minister (Thatcher/Major in 1990 and Blair/Brown in 2007). The chart below shows the history of the poll differential between the main governing and opposition parties and the “prediction” of the model. While there are periodic significant divergences, it is, perhaps, surprising how much of the variation in polls can be explained by economic factors and honeymoon effects.

The Guardian-ICM poll published this week reports a Conservative-Labour differential of -5 percentage points, which is in line with the current model estimate. Election “swingometers” designed to translate voting intentions into seat predictions indicate that this would deliver a sizeable Labour majority. The next chart, derived from the swingometer on the Electoral Calculus website, shows required Conservative-Labour differentials that would result in majorities for either party for different levels of support for the Liberal Democrats, assuming that UKIP and smaller parties account for 10% and 5% of the vote respectively*. If the Lib Dems maintain their 12% showing in the latest Guardian-ICM poll, the suggestion is that the Conservatives need to open up a lead of about 6 percentage points over Labour to achieve a majority, and to be 3 points ahead to hold the most seats in a hung parliament, implying a first shot at forming a new coalition government.

Economic trends are moving in the Conservatives’ favour but will they deliver the necessary turnaround in the polls? The model can be used to examine this issue. The first scenario considered assumes that the economy performs in line with the Bank of England’s latest forecast**. The Bank expects average earnings growth to rise to 2.75% by the fourth quarter of 2014 and 3.75% by end-2015. The unemployment rate drops from the current 6.9% to 6.5% by the time of the election, while inflation is broadly stable. The forecast incorporates the market expectation that overnight interest rates will rise to 0.8% in the second quarter of 2015, implying a quarter-point increase in Bank rate. The Bank does not publish its projection for house prices – these are assumed to rise by 10% per annum. On these assumptions, the model estimates that the Conservatives would move into a 1.5 percentage point lead by May 2015, i.e. insufficient even for them to gain a plurality of seats in a hung parliament – see chart below.
The judgement here is that the economy will perform more strongly than the Bank expects, leading to a more rapid fall in unemployment and greater upward pressure on earnings. The second scenario considered assumes that earnings growth rises to 4% by the time of the election, while the unemployment rate drops to 5.7%. An additional difference is that Bank rate is held at 0.5% until after the election. The other assumptions – i.e. for inflation and house prices – are unchanged. According to the model, this “best case” scenario for the Conservatives would give them a lead of about 6 percentage points over Labour by May 2015, suggesting that they could scrape home with a single-figure seat majority if Lib Dem and UKIP support remains at current levels.
The problem, of course, is that the scenario is internally inconsistent – the strong pick-up in wage growth would be likely to push inflation higher and force the Bank of England to raise interest rates. A final scenario was considered maintaining the “best case” assumptions for earnings and unemployment but in which retail price inflation rises from the current 2.5% to 3%, while Bank rate is increased in two quarter-point steps to 1.0% by May 2015, with this leading to a slowdown in house prices. The Conservative-Labour lead is reduced to 2.5 percentage points, suggesting that the two parties would hold similar numbers of seats in a hung parliament.

Summing up, the modest impact of better economic news on Conservative support is understandable, because strong growth has only recently started to feed through to a recovery in real earnings. Faster pay expansion and a further unemployment decline could lift the Conservative-Labour differential by as much as 10 percentage points over the next 12 months. The associated economic scenario, however, would warrant a rise in interest rates, which would probably reverse part of the Tory gain. The outcome of the 2015 election will depend importantly on whether the Bank of England sets policy purely on economic grounds or delays necessary action to avoid overt influence on a close political race.
*Increasing the UKIP percentage to 15% has only a minor effect on the results.
**February Inflation Report forecast based on market-implied interest rates.
Is UK national saving too low?
The Office for National Statistics recently announced that its implementation of a new accounting framework in September 2014 will substantially boost the household saving ratio. Specifically, the increasing pension entitlements of members of funded defined benefit schemes will, from September, be included in income and saving. Initial work indicates that the change will boost annual saving ratios over 1997-2011 by between 3.4 and 6.3 percentage points. The saving ratio of 5.0% in the fourth quarter of 2013 could rise to about 10%.
The Financial Times article that covered this story was titled “Data shake-up turns UK into nation of savers”. The pension accounting change, in fact, will have no impact on the national saving ratio. The rise in the household ratio will be counterbalanced by a fall in recorded saving of companies and government bodies responsible for funded defined benefit schemes. The change, indeed, should turn the current corporate financial surplus – the excess of retained income over capital spending – into a deficit.
Total national saving out of domestic income was equal to 12.7% of GDP in the fourth quarter. This ratio has trended sideways since the 2008-09 recession but is far below its average of 16.0% since 1985 – see chart.
Is this a concern? Saving is necessary to fund capital accumulation to support supply-side growth. The relative price of capital goods, however, has been trending lower in recent decades, partly reflecting the IT revolution. A given national saving ratio, therefore, funds a higher real investment share of GDP than in the past. The chart shows an alternative measure that adjusts for this relative price effect*. This real saving ratio is much closer to its long-run average.
The value of saving, moreover, depends on the quality of the investment it finances. The real saving ratio rose above average over 2006-07 but much of the associated capital accumulation was misdirected, as evidenced by a subsequent prolonged slump in productivity. If capital allocation has improved, the current low ratio may not act as a constraint on long-run economic growth.
A rise in aggregate saving would be welcome and may occur if fiscal consolidation continues and the Bank of England normalises interest rates. The current saving ratio is of less concern for longer-run economic prospects than the risk that the Bank will hold rates below a rising “neutral” level, as it did during the mid 2000s, resulting in further capital misallocation.
*The alternative measure shows the hypothetical saving ratio that would have had the same purchasing power in terms of capital goods assuming prices fixed at their 2010 level.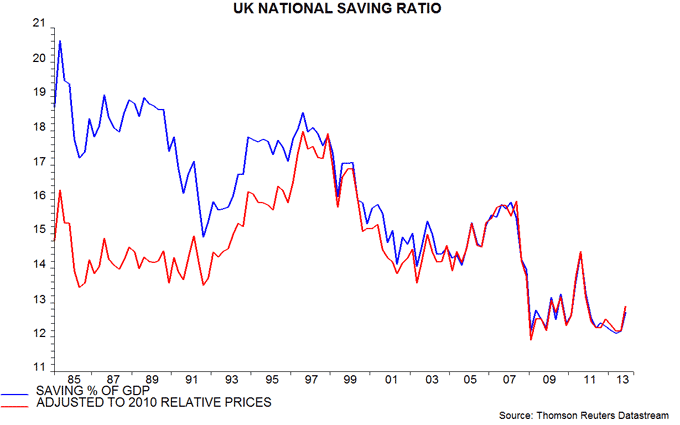
Chinese money / credit trends consistent with moderate growth
Chinese equities reacted negatively to news that annual growth in the M2 money supply fell to 12.1% in March – below the 13% official target for 2014 and the lowest on record in data extending back to 1998. The forecasting approach here emphasises the six-month change in inflation-adjusted M2*. This measure edged lower in March but is in line with its average over 2011-13 and above readings between September and November last year – see first chart.
Six-month real M2 growth has been supported by a recent fall in inflation: consumer prices* rose by an annualised 1.4% in the six months to March, down from 3.3% in the previous half-year.
Six-month expansion of the narrower M1 measure, inflation-adjusted, rose slightly in March, though remains weak by historical standards. Real bank lending and the broader “total social financing” credit aggregate, meanwhile, are growing respectably – second chart.
Slower industrial output growth since late 2013 was foreshadowed by a fall in real M2 / M1 expansion from spring 2013. The partial reversal of this decline recently suggest that industrial momentum will bottom during the second quarter, recovering slightly over the summer. Monetary trends, in other words, are not signalling a “hard landing”, although growth will remain below par by the standards of recent years.
*Seasonally adjusted.


