Entries from March 30, 2014 - April 5, 2014
In defence of the ECB's hold decision
The ECB is under fire for keeping policy stable despite supposed deflationary dangers. Posts here were highly critical of the central bank in 2011, when it tightened policy in the face of real money supply contraction, thereby guaranteeing a recession. Its stance, however, reversed dramatically under President Draghi, resulting in the current economic recovery. While policy should be kept under review, the ECB’s passivity is justified.
-
The recent further fall in CPI inflation to 0.5% in March reflects weaker food and energy prices, which may prove temporary and, in any case, are positive for real incomes. The March result was also depressed by Easter timing effects (i.e. an Easter boost lifted prices in March 2013 but will occur in April this year*).
-
Core inflation and wage growth stabilised in late 2013, consistent with a stabilisation and improvement in monetary trends from late 2011 – monetary developments lead price and wage pressures by about two years, according to the Friedmanite rule. This rule suggests that domestic inflation will gradually revive in 2014-15 – see chart.
-
Current monetary trends are satisfactory. Annual narrow money M1 growth of 6.2% is slightly below the EMU-era average in nominal terms (7.5%) but equal after inflation adjustment. M3 growth remains weak at only 1.3% but M3 velocity is rising in response to falls in deposit interest rates. The monetary impact of credit contraction is being offset by a strong balance of payments surplus.
-
Exchange rate strength is unwelcome but reflects policy laxity elsewhere and may reverse if the US economy picks up speed this summer, as suggested by narrow money buoyancy. It is doubtful that the trend would be affected by a small cut in interest rates.
-
As previously discussed, there is little evidence that QE programmes in the US, UK and Japan have boosted economic performance or even monetary growth significantly. In Japan’s case, real money expansion is lower than when its QE blitz was launched in April 2013; it is lower, indeed, than in the Eurozone currently. QE has succeeded in driving the yen down but to little effect – the export volume response has been pitiful, as it was in the UK after sterling’s 2007-08 crash.
With monetary trends stable, market interest rates falling, surveys signalling an ongoing economic recovery and global prospects probably brightening, the ECB’s inertia is warranted. Policy-makers are rightly allowing for the lag in the money / inflation relationship; reacting to the latest CPI data would be destabilising. They should retain an easing bias but act only if narrow money growth falters.
*Accordingly, April CPI inflation may overstate the underlying trend.
UK household wealth / income ratio approaching new record
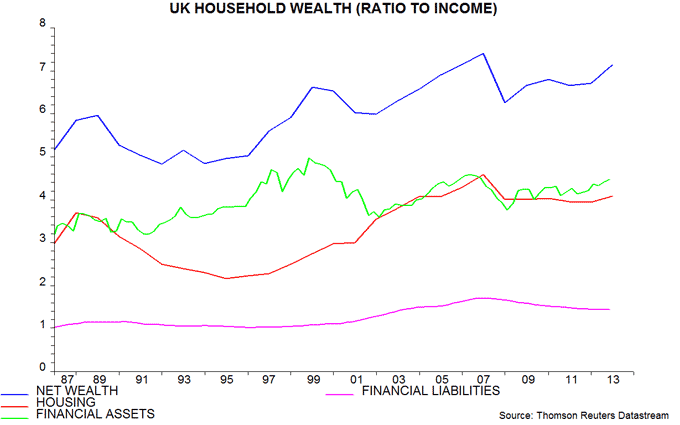
UK households’ net housing and financial wealth (i.e. the value of housing and financial assets minus financial liabilities) rose by an estimated* 8.3% during 2013, pushing its ratio to annual disposable income up to 7.14 – close to a record high of 7.4 reached at end-2007.
The first chart shows the net wealth to income ratio broken down into housing, financial assets and financial liabilities. The recovery in the ratio since 2008 has been driven by rising financial wealth and a reduction in liabilities. The housing wealth to income ratio has been broadly stable over this period, though increased in 2013 as house prices picked up.
The rise in net financial wealth mainly reflects gains in equity and bond markets but, in addition, households ran a large financial surplus over 2009-12, cumulating to 8.9% of annual income over the four years (i.e. income exceeded consumption and capital spending over this period, allowing households to accumulate financial assets and / or reduce debt).
The net wealth to income ratio is likely to reach a new record by end-2014, assuming house price inflation of about 10% during the course of the year and stable financial markets.
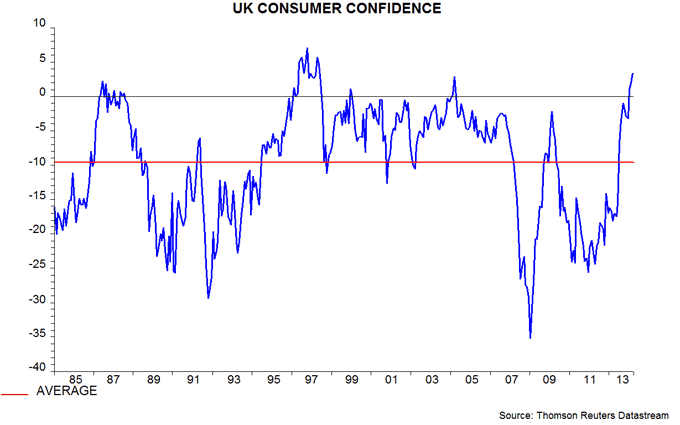
Rising wealth helps to explain why consumer confidence is at the top of its historical range despite the “cost of living crisis” – second chart. It also tempers concern about a recent fall in the saving ratio, which, in any case, remains respectable – 5.0% in the fourth quarter of 2013, close to a 20-year average of 5.5%.
*Based on actual data on financial assets / liabilities and income, and an assumption that the value of the housing stock rose by 5.5% during 2013, equal to the increase in the ONS house price index between December 2012 and December 2013.


Global money trends signalling summer growth rebound
Global* real narrow money trends continue to suggest that industrial output growth will pick up from a trough to be reached in the late spring. Confidence in this forecast would be strengthened by an upturn in the longer leading indicator followed here – a February reading will be available next week.
Posts last autumn argued that six-month growth in global industrial output would peak at end-2013 and moderate in early 2014, while remaining respectable – see, for example, here. This forecast rested on a slowdown in real money expansion from spring 2013 and a confirming decline in the longer leading indicator last summer. Output growth peaked in November / December and is estimated to have fallen again in February, based on data covering two-thirds of the global aggregate – see first chart. Incoming March manufacturing business surveys are consistent with further modest softening.
Global six-month real narrow money expansion, however, bottomed over September-November and has picked up strongly in early 2014, reaching a 16-month high in February** – first chart. Allowing for the typical half-year lead, the message is that industrial output growth will trough around May and rebound through late summer. Note also that a large gap is opening up again between real money and output expansion, implying “excess” liquidity support for markets.
This forecast would be confirmed by an upturn in the longer leading indicator, which is derived from OECD country leading indicator data but provides earlier warning of turning points. The indicator leads by an average 4-5 months and stabilised in January, although this reading is subject to revision – second chart. A February update will be available on 8 April.
As previously discussed, the global real narrow money pick-up has been led by the US, although E7 growth has also firmed slightly – third chart.
*”Global” = G7 developed economies and E7 emerging economies.
**February data available for all G7 and E7 countries except Korea.


UK monetary trends solid / stable; credit still weak
UK monetary trends remain upbeat, with rising corporate liquidity supporting hopes of strong business investment.
The forecasting approach here emphasises real narrow money, as measured by non-financial M1* deflated by consumer prices. This rose by 4.3%, or 8.7% annualised, in the six months to February. Growth has been stable since spring 2013 and is well above the long-run average – see chart.
Real non-financial M4, a broader measure, rose by a smaller 1.8%, or 3.5% annualised, although this represented the strongest growth since April 2009. As previously discussed, a given rate of increase of broad money supports faster nominal GDP expansion than in the past because the velocity of circulation is now on a rising trend. This partly reflects households shifting savings into non-monetary form in response to negative real deposit interest rates.
Modest overall M4 growth, in other words, has not prevented a strong rise in corporate liquidity: real M4 holdings of private non-financial corporations rose by 4.4%, or 8.9% annualised, in the latest six months.
The six-month rates of change of real non-financial M1 and M4 bottomed in April 2011, rising over the subsequent two years to peak in April 2013. Underlying two-quarter GDP expansion (i.e. excluding North Sea production and adjusting for special bank holidays and the Olympics) bottomed in the first quarter of 2012 and rose through the third quarter of 2013, stabilising in the fourth quarter. This is consistent with the monetarist rule that (real) money supply changes lead demand and output by about six months.
Stable real money trends since last spring are the basis of the forecast here that GDP will continue to rise by 0.75% per quarter through 2014**, generating full-year growth of about 3%. The first quarter, however, is likely to overshoot this projection, based on available evidence – see Friday’s post.
Real non-financial M4 lending contracted slightly in the six months to February – the claim that current economic strength is being driven by credit-fuelled excess continues to have no basis in fact.
*Currency and sterling sight deposits held by households and private non-financial firms.
**Growth averaged 0.75% in the final three quarters of 2013.


