Entries from March 23, 2014 - March 29, 2014
UK onshore GDP exceeds prior peak in January
First-quarter GDP growth is on course to match or beat the Bank of England’s 0.9% expectation, judging from January output figures for services, industry and construction, together accounting for 99% of the economy.
Output levels in January were above fourth-quarter averages in all three sectors – by 0.7% in services, 0.4% in industry and 1.8% in construction. Based on shares in the economy of 78%, 15% and 6% respectively, these gains imply a 0.75% rise in GDP between the fourth quarter and January.
Assume, reasonably, that GDP rises by a further 0.25% per month in February and March, equivalent to a 3% annualised growth rate. First-quarter expansion would then be 1.0%.
According to the February Inflation Report, the Bank expects first-quarter GDP growth to be estimated initially at 0.8%, with a subsequent revision to 0.9%. A 1.0% initial print*, therefore, would be another upside surprise for policy-makers.
GDP in the fourth quarter of 2013 was still 1.4% below its peak reached in the first quarter of 2008 but the shortfall in onshore output – i.e. excluding North Sea oil and gas extraction – was only 0.5%. Onshore GDP, therefore, is already at a new high, based on the January output data – see chart.
*The preliminary estimate is scheduled for release on 29 April.
Eurozone monetary trends signalling stable economic expansion
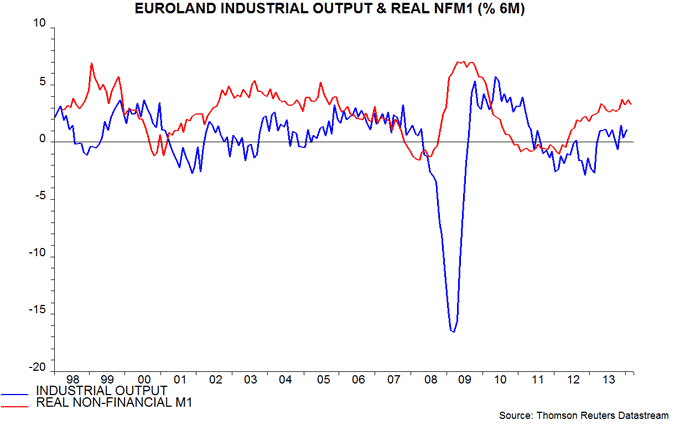
Eurozone real non-financial M1* – the best monetary leading indicator of the economy, with a flawless track record in recent years – continues to signal moderately positive growth prospects. Country trends suggest similar economic performance in the core and periphery.
Real non-financial M1 rose by 3.3% in the six months to February, or 6.7% annualised. Growth has been broadly stable in recent months and is above the long-run average. The six-month change turned negative before the 2008 and 2011 recessions and positive before the 2009 and 2013 recoveries – see first chart. Current trends are consistent with GDP expansion of about 2% annualised through late 2014.
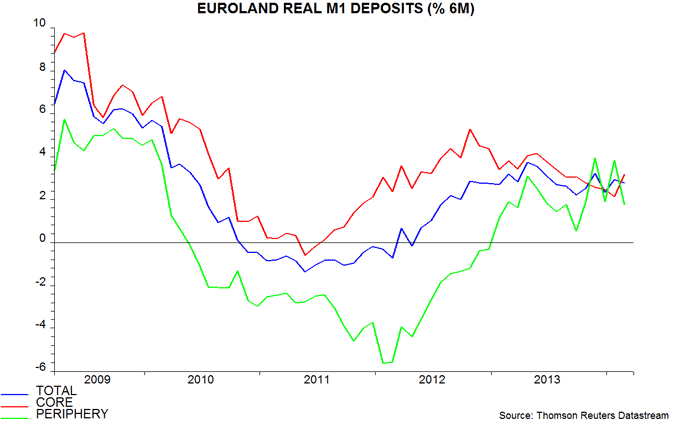
The ECB publishes country data on overnight deposits**, which dominate swings in M1. Six-month growth of real deposits in the core and peripheral groupings has been similar recently, suggesting economic convergence – second chart. Peripheral expansion was lower than in the core in every month between September 2008 and October 2013.
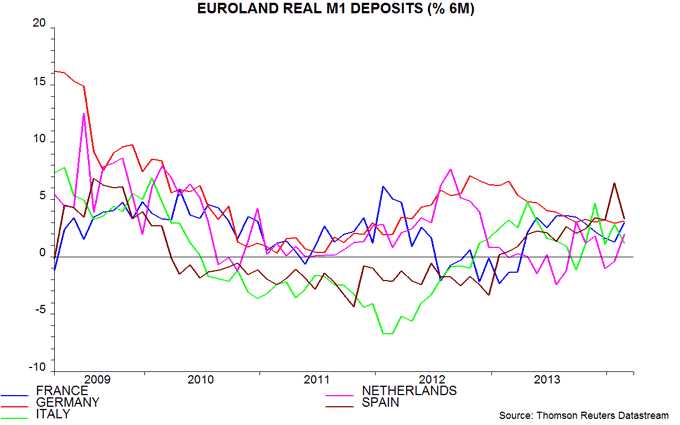
Country-level divergences have also narrowed, with real deposit growth now almost equal in Spain, Germany and France and only slightly lower in the Netherlands and Italy – third chart.
The economic recovery has defied the predictions of followers of broad money and credit. Six-month growth of Eurozone real M3 edged up in February but was still only 0.5% (1.0% annualised), while bank credit continues to contract, albeit at a slowing pace.
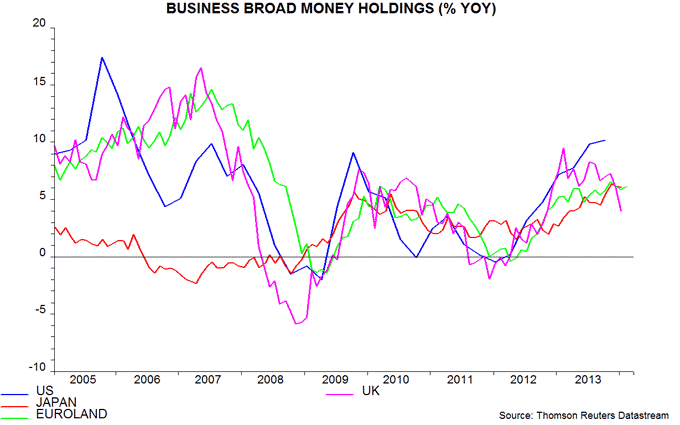
The broad monetarists have been wrong because they have ignored a reallocation of households savings away from money holdings due to near-zero deposit interest rates. Low M3 growth, therefore, has not constrained corporate liquidity or the supply of money to finance economic transactions. Corporate M3 deposits, indeed, grew by 6.1% in the year to February. Similar solid expansion of corporate liquidity is occurring in other major economies – fourth chart.
Households are likely to continue to shift funds out of the banking system, especially with ECB officials speculating about imposing a negative deposit rate, the cost of which banks would be forced to pass on to savers and / or borrowers.
The creditist bears were wrong because credit trends affect the economy only via their impact on the money supply. Lending contraction has not prevented M3 from expanding, albeit weakly, because of positive contributions from other “monetary counterparts”. In particular, the strong Eurozone balance of payments position has resulted in banks’ net external assets rising by €389 billion over the last 12 months, equivalent to 3.9% of the stock of M3.
*Notes and coin in circulation plus overnight deposits of households and non-financial corporations divided by consumer prices, seasonally adjusted.
**Country figures cover all sectors (i.e. financial as well as non-financial).
UK inflation good news approaching an end
Consumer price inflation fell from 1.9% in January to 1.7% in February, reflecting favourable effects from motor fuel costs, gas / electricity prices and clothing. This decline was expected and the forecast here remains for inflation to rise from the spring and end the year at about 2.75%. This assumes a firming of core pressures in lagged response to faster monetary growth and eroding spare capacity, and a rebound in food / energy costs.
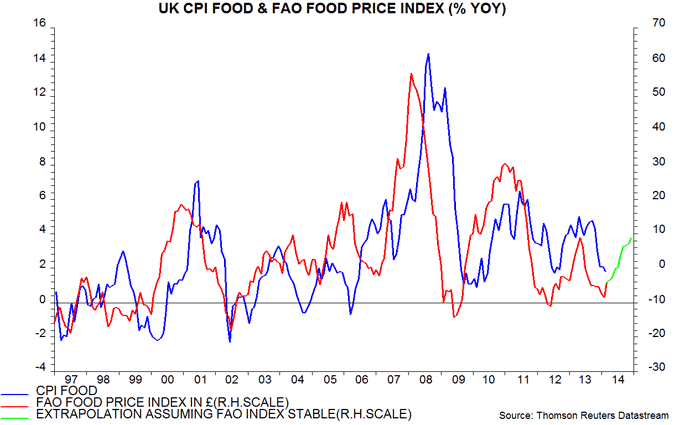
The annual rise in food prices has slowed from 4.1% to 1.8% over the past 12 months, cutting 0.2 percentage points from CPI inflation. A surge in global food commodity prices since December, however, suggests that CPI food inflation is close to a low and will revive to 3-4% by late 2014 – see first chart*. There may be additional upward pressure from domestic supply disruption due to the recent floods.
Annual energy price inflation has fallen from 4.0% to 0.6% over the past year, cutting a further 0.3 percentage points from the CPI rate. Motor fuel costs in February were 5.5% lower than a year before but are assumed to rise modestly later in 2014, as ongoing solid global economic expansion is reflected in a firmer oil price. Gas / electricity prices will be restrained by recent government initiatives but may still increase by about 5% over the course of 2014. The forecast here assumes that energy inflation returns to about 4% by end-2014.
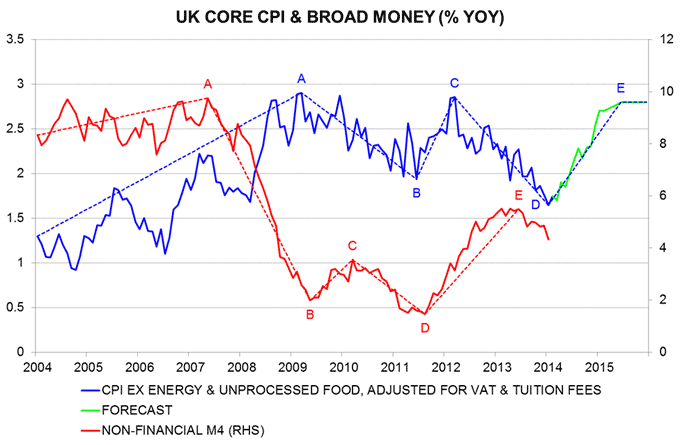
“Core” CPI inflation, i.e. excluding energy and unprocessed food and adjusted for changes in VAT and undergraduate tuition fees, was 1.9% in February, unchanged from October but down from 2.5% a year before. Trends in core inflation have followed monetary growth with a lag of about two years, in line with the monetarist rule – see previous post and second chart. This relationship suggests that the core rate is bottoming and will rise over the remainder of 2014 – the forecast assumes a return to 2.5% by year-end.
The forecast could be undershot if sterling rises further, particularly against the dollar. The US economy, however, may surprise positively in mid-2014 based on recent narrow money strength – see previous post – lifting interest rate expectations and the currency.
The suggestion that inflation is bottoming is supported by the alternative RPIJ measure, based on the components and weights of the RPI and the CPI’s calculation method. This measure reached a low of 1.9% in October and was 2.0% in February.
*FAO = UN Food and Agriculture Organisation.

