Entries from March 16, 2014 - March 22, 2014
UK external finances sound despite current account deficit
Proponents of the view that economic strength is unsustainable often cite a widening current account deficit as evidence that Britain is “living beyond its means”. This neglects a large capital gain on overseas investments in recent years; this gain has more than offset the deficit, resulting in a significant improvement in the net investment position.
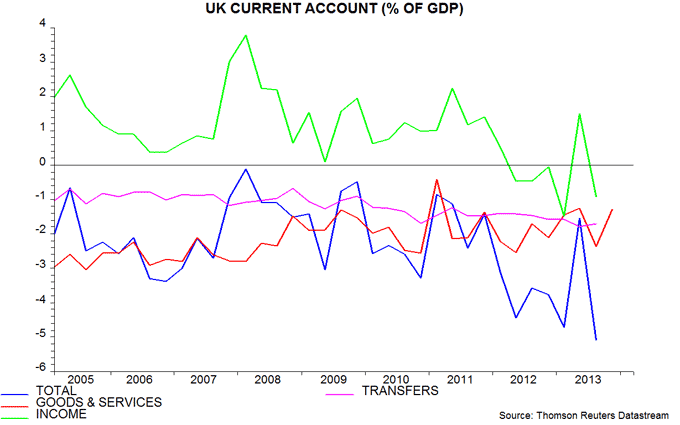
The current account deficit rose from 1.5% of GDP in 2011 to 3.8% in the first three quarters of 2013*. The current account is the sum of balances on trade in goods and services, income and transfers. The trade deficit was 1.6% of GDP in 2013, exactly in line with its long-run average**, and has been stable in recent years. The transfers deficit is also little changed since 2011. The rise in the current account shortfall reflects a shift in the income balance from substantial surplus to deficit – see first chart.
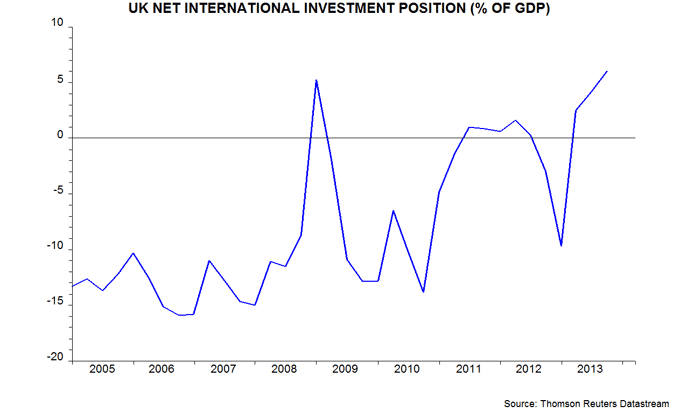
Current account deficits have a negative impact on a country’s net international investment position (NIIP), since they must be financed either by borrowing from overseas or selling foreign assets. The UK’s NIIP, however, has improved from -13% of GDP (i.e. assets less than liabilities) at end-2004 to 6% by the third quarter of 2013 – second chart. This reflects changes in capital values of existing assets / liabilities.
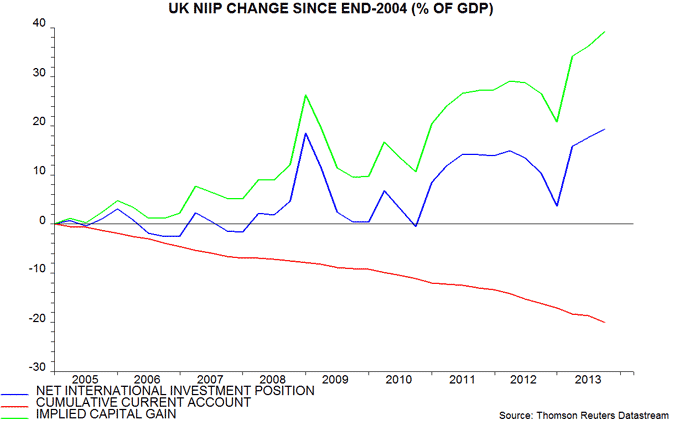
The 19 percentage point rise in the NIIP / GDP ratio since end-2004 compares with a cumulative current account shortfall of 20% of GDP over this period. The implied capital gain on the stock of net assets, therefore, is a whopping 39% of GDP – third chart.
Put differently, the current account position adjusted for changes in capital values has been in substantial surplus in recent years, including 2013.
A stable, modest trade deficit and rising overseas wealth support the view here that strong economic growth will be sustained. The wider current account deficit reflects a shift, probably temporary, in the form in which a return is delivered on overseas wealth from income to capital gain – only the former is counted in the current account but both should be included in an assessment of the external finances.
*Fourth quarter due on Friday 28 March. The deficit was 5.1% of GDP in the third quarter alone but this followed a low outcome – 1.5% – in the second quarter.
**Fourth quarter already available. Official data extend back to 1992.


UK Budget surprisingly creative but fiscal risks still high
With no fiscal room for manoeuvre, the Chancellor nevertheless managed to deliver a major reform of savings along with other headline-grabbing measures that will please his political supporters.
The changes to pensions and ISAs should enhance long-term economic performance by encouraging saving and promoting a more productive allocation of capital, partly by reducing “structural” flows into long-term gilts as annuity rules are relaxed.
The time-limited doubling of the business investment allowance, on the other hand, is a tinkering measure designed to give a boost to capital spending and the wider economy ahead of the 2015 election, with payback from 2016.
A further rise in the personal allowance, cuts in alcohol and air passenger duties, the higher investment allowance and energy reliefs for businesses are paid for by another attack on tax avoidance / planning, lower public sector pension costs and a positive near-term effect on receipts from the savings reforms.
The introduction of competitive National Savings bonds for pensioners from January 2015 will have the effect of tightening monetary conditions, assuming that the Bank of England has not already raised Bank rate by then. The assumption is that one-year bonds will yield 2.8%, which compares with an average rate on one-year bank instruments currently of 1.4%. The bonds will raise £10 billion, equivalent to about 4% of the household sector’s stock of time deposits. The competition is likely to force banks to improve their own rates, with a knock-on effect on interest costs for borrowers.
The Office for Budget Responsibility’s (OBR) assessment that the Chancellor is meeting his fiscal mandate rests on its judgemental assumptions that GDP was still 1.7% below its sustainable potential level at end-2013 and potential will grow by 2.1% per annum over 2014-18. The former is at odds with its statistical analysis of cyclical indicators, which suggests that the GDP / potential gap is negligible or even positive.
In a plausible alternative scenario in which potential output is 2% lower than in the central case and gilt yields 100 basis points higher, the cyclically-adjusted current budget would still be in small deficit in 2018-19, based on the OBR’s ready reckoners. The fiscal position, in other words, remains fragile and the OBR has arguably given the Chancellor too easy a ride.
UK real wage pick-up undermines "fragile economy" claims
A measure of private sector pay incorporating a 12-month smoothing of bonuses rose by 0.9% more than consumer prices in the year to January, confirming that real wages are picking up more strongly than the Bank of England and consensus expected.
Private sector regular weekly earnings rose by 2.2% in the year to January versus CPI inflation of 1.9% in that month. Bonuses, meanwhile, increased by 8.7% in the 12 months to January from a year before. A measure of total pay calculated by adding regular earnings and a 12-month moving average of bonuses, therefore, rose by an annual 2.8% in January. This pay growth measure was below CPI inflation between July 2008 and November 2013 – see first chart.
Whole-economy growth, i.e. incorporating public sector workers, is lagging the private sector but was also above inflation in January, at 2.2%.
The earlier-than-expected resumption of real wage growth further undermines the Bank’s claims of economic fragility and may have a significant political impact – statistical analysis confirms that real wage trends influence the poll gap between the main governing and opposition parties.
A key issue is whether the real wage pick-up reflects a recovery in productivity growth or a shift in the balance of power in favour of workers, due to a tight labour market. Productivity optimists will cite an increase in aggregate hours worked of only 0.1% in the three months to January from the prior three months – well below quarterly GDP growth currently estimated at 0.7% in the fourth quarter. Some productivity catch-up, however, had been expected following dismal performance in the year to the third quarter, when whole-economy output per hour rose by only 0.1%.
The vacancy rate – the stock of unfilled positions expressed as a percentage of employee jobs – continues to suggest that labour market slack has been eliminated, rising further to 2.1% in the three months to January versus a post-1995 average of 2.0%. The divergence between the vacancy and unemployment rates casts strong doubt on the Bank’s view that the latter can fall to 6-6.5% without generating inflationary pay pressures – second chart.


US economic news consistent with further "taper"
The Federal Reserve is likely to taper bond purchases by a further $10 billion to $55 billion a month at its policy meeting this week and may stop buying by the end of the third quarter as the economy reaccelerates.
The chart shows a long history of the “headline” policy rate* together with an indicator** designed to summarize data influences on the Fed’s thinking. The indicator gave advance warning of changes in interest rate direction up to and including the 2008-09 crisis, and has been informative about QE policy more recently.
The indicator was below zero, suggesting policy easing, when the Fed launched QE1 and QE2 in December 2009 and November 2010 respectively. It turned significantly positive in early 2011, however, signalling that QE2 would not be extended beyond its scheduled end in June. A renewed slide towards zero during 2012 preceded the launch of QE3 in September of that year and its expansion in December.
The indicator had been recovering for several months when the Fed announced tapering in December 2013. It has risen further in early 2014 and is just below its level ahead of the suspension of QE2 in June 2011.
Monetary trends signalled that economic growth would moderate in early 2014 but are now suggesting another pick-up from mid-year – see previous post. If correct, the policy indicator may stabilise near term before pushing higher again in the summer. Economic reacceleration may cause the Fed to end QE3 in July or September rather than in the fourth quarter, as implied by tapering of $10 billion per meeting.
*The Fed has announced publicly its target for the Fed funds rate since February 1994; the discount rate was the immediately visible policy rate before that date.
**The indicator is based on changes in core CPI inflation and unemployment and the ISM manufacturing vendor deliveries index, which measures supply chain delays. The latter two components are responsible for the current positive reading.

